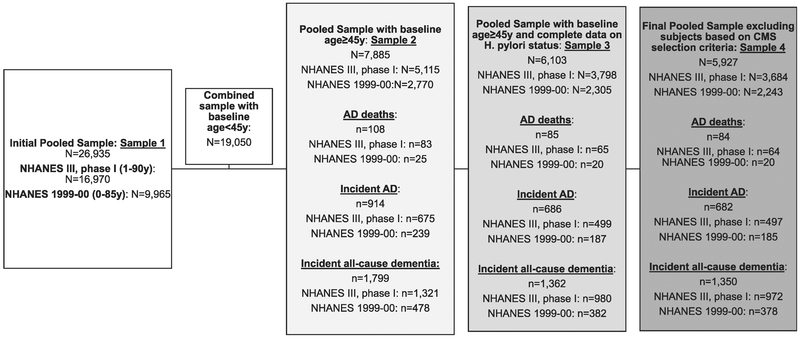
Fig. 1.
Participant flowchart. Sample 4, mean ± SD of follow-up time (months): AD deaths: NHANES III, phase I: 174.0 ± 86.1 NHANES 1999–00: 120.0 ± 38.1. Incident AD: NHANES III, phase I: 170.3 ± 86.5 NHANES 1999–00: 117.4 ± 40.7. Incident all-cause dementia: NHANES III, phase I: 165.3 ± 87.6 NHANES 1999–00: 114.7 ± 43.6. Additional missing data (n = 41 observations for pooled analysis, n = 38 for NHANES III, phase I, and n = 3 for NHANES 1999–00) is found for each type of analysis, given that some sample weights were not valid and/or observations end before enter (i.e., prevalent cases of AD and all-cause dementia). Abbreviations: AD, Alzheimer’ disease; H. pylori, Helicobacter pylori; NHANES, National Health and Nutrition Examination Surveys; SD, standard deviation.

