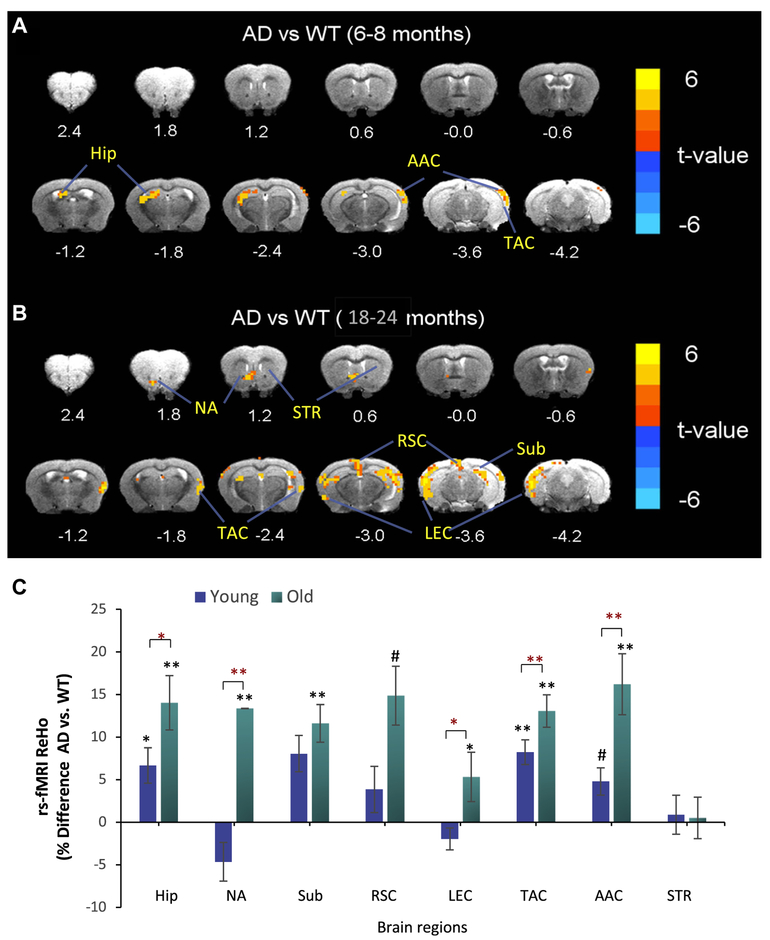
Fig. 1.
Brain regional resting state functional magnetic resonance imaging analysis reveals age-related increases in ReHo in Hip and functionally associated cerebral cortical regions in 3 × TgAD mice. ReHo analysis was performed on young and old 3 × TgAD (AD) and WT mice. (A and B) Images showing ReHo in AD versus WT mice at young (A; 6–8 months of age) and old (B; 18–24 months) ages. Brain topography revealed regions with elevated ReHo (t-values) in AD versus WT mice (n = 8–10 mice/group). (C) Regional ReHo data are expressed as percentage difference in ReHo values of 3 TgAD mice compared to WT mice. Values are the mean and standard error of the mean. #p < 0.05, AD versus WT (asterisk); p < 0.01, AD versus WT (double asterisk); #p < 0.05, young versus old (red asterisk); p < 0.01, young versus old (red double asterisk). Abbreviations: AAC, auditory association cortex; AD, Alzheimer’s disease; EC, entorhinal cortex; Hip, hippocampus; NA, nucleus accumbens; ReHo, regional homogeneity; RSC, retrosplenial cortex; Sub, subiculum; STR, striatum; TAC, temporal association cortex; WT, wild type. (For interpretation of the references to color in this figure legend, the reader is referred to the Web version of this article.)

