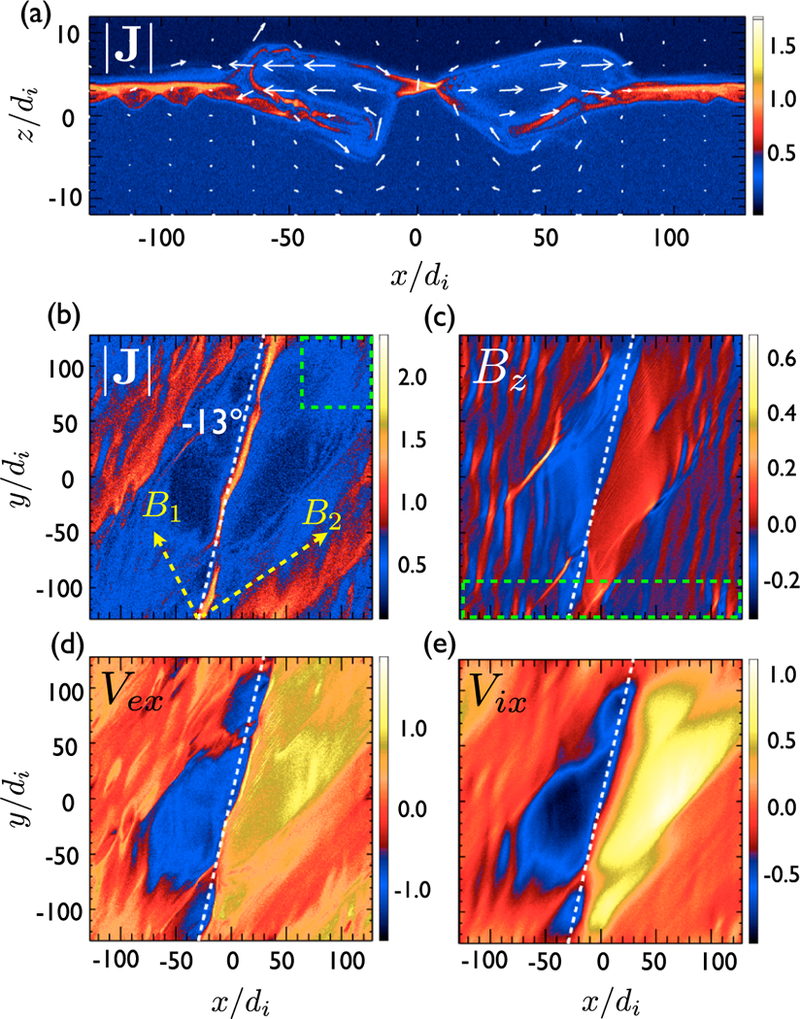
Figure 2.

Quantities at time 184/Ωci. In (a) the total current density |J| on a 2-D plane where y = 0. The white arrows show the in-plane electron velocities. In (b) the x-y cut of |J| across the location of the intense current near the x line. Similarly, in (c), the reconnected field Bz; in (d), the electron outflow Vex; and in (e), the ion outflow Vix. On top of the figures, yellow arrowed lines in (b) illustrate the magnetic fields on two sides of the current sheet, and white dashed lines in (b)-(e) have 9 = −13°.
