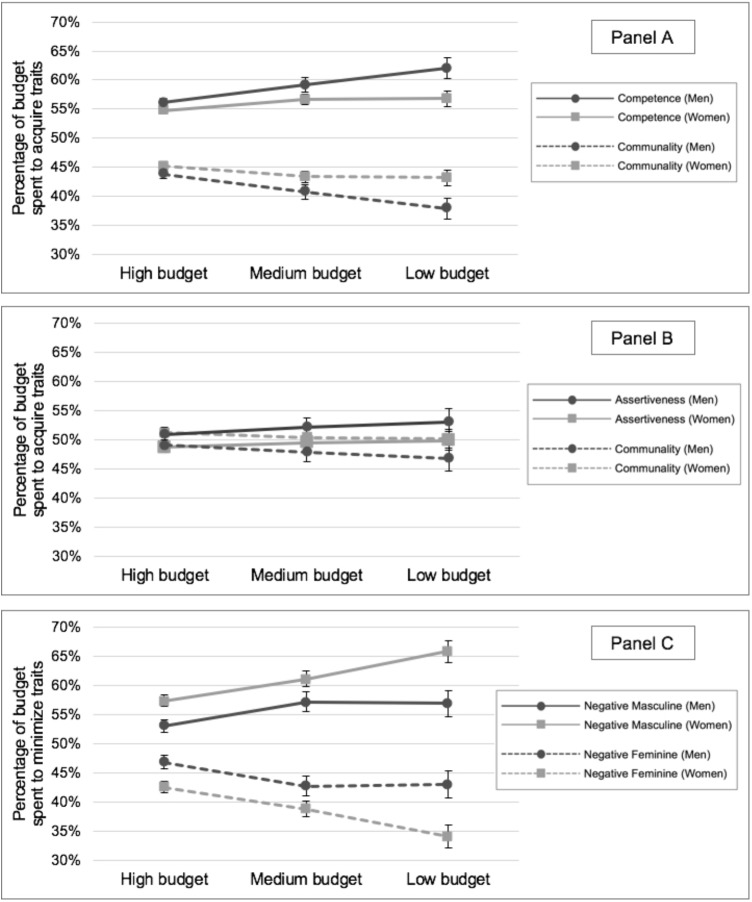
FIGURE 1.
Ideal percentages for the three trait categories as a function of budget and participant gender in Study 1. Error bars represent the standard error of the mean. (A) Ideal percentages of the budget allocated to maximizing competence versus communality. (B) Ideal percentages of the budget allocated to maximizing assertiveness versus communality. (C) Ideal percentages of the budget allocated to minimizing negative masculine versus feminine stereotypes.

