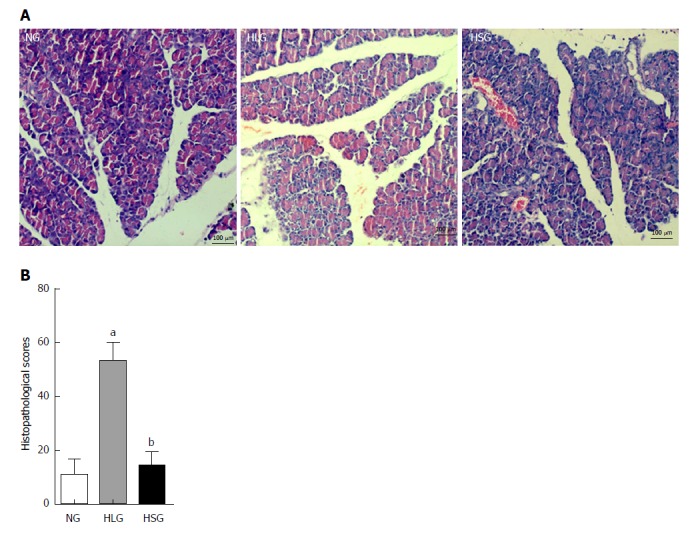
Figure 1.

Histological images and pathologic scores of pancreatic tissues from the three experimental groups. A: Pathological images of the pancreatic tissues (× 200); B: Histological scores of the pancreatic tissues. The results are presented as the mean ± SD. aP < 0.05 vs NG; bP < 0.05 vs HLG. NG: Normal group; HLG: High-fat diet group; HSG: High-fat diet group treated with Sheng-jiang powder.
