
Figure 5.
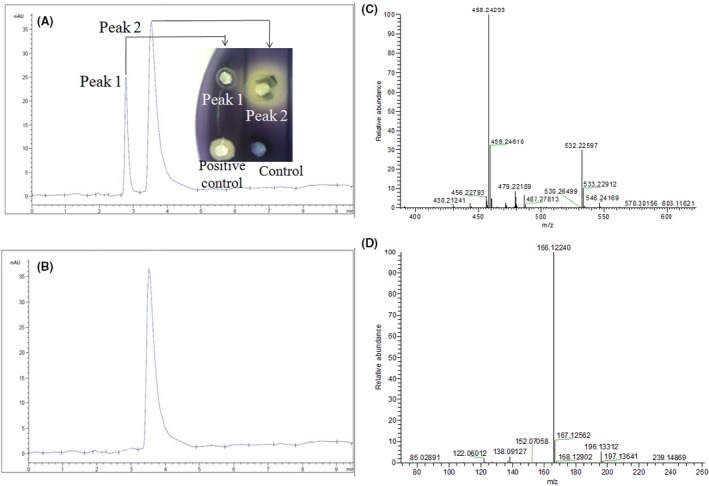
Analysis of bioactive fractions showing quorum‐sensing inhibition. Pre‐HPLC (A) and UPLC (B) analysis of the V. lyticus 12 extract. The chromatogram shows its two main active fractions. The inset image in (A) is the re‐test of QSI activity of the two peak compounds. In the inset image, the “60% methanol + collected extract” and “60% methanol only” represented the positive and negative controls respectively. The GC/MS chromatograms (positive ions) (C) and GC/MS chromatograms (negative ions) (D) of the active fraction (peak 2) of the V. alginolyticus12 extract. Peaks represent a function of intensity measured in milli‐absorption units over time (min).