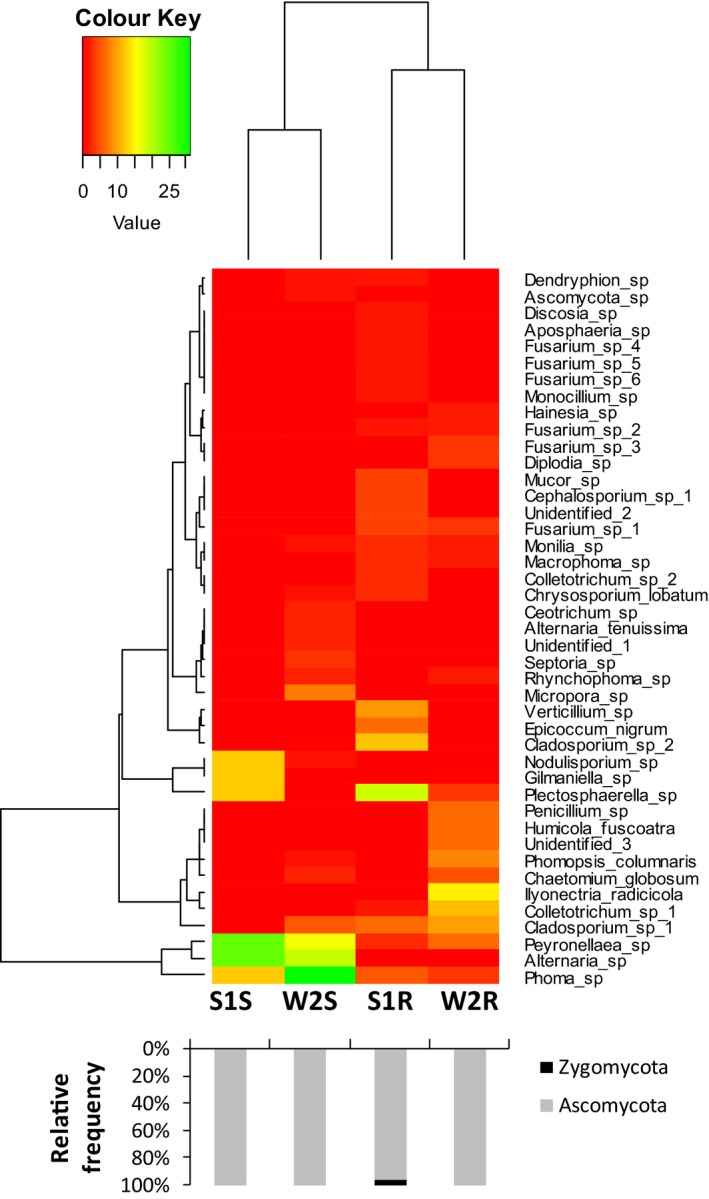
Figure 3.

Heat maps of the relative abundance of culturable fungal endophytes of D. ambrosioides in different tissues and locations. Different colour means the different RF of the taxa in the all four samples (green means high RF) (S1 = Slag heap, W2 = Wasteland; S = Shoot, R = Root). The black and grey bars below show the phylum of the fungal endophytes isolated.
