Figure 2.

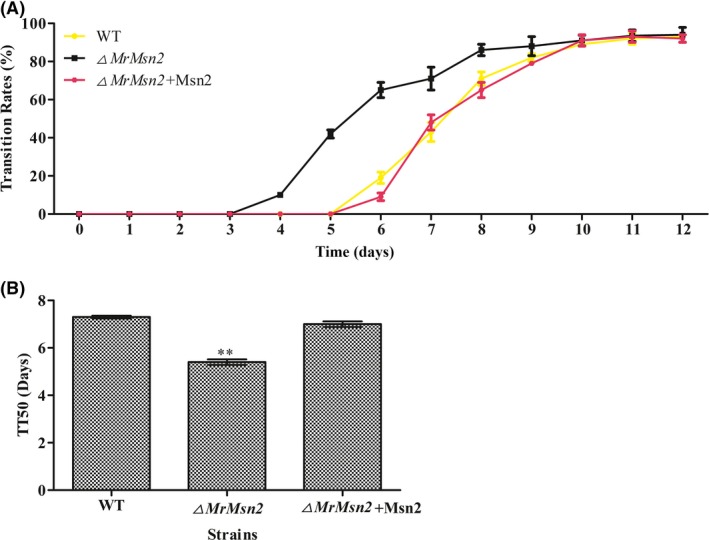
Quantitative analysis dimorphic transition of test strains.
A. Quantitative analysis of dimorphic transition (from yeast cells to hypha) rate of wild‐type, complemented and ▵MrMsn2 mutants with approximately 100 single yeast cells plated on SMAY medium. The growth morphology was observed every day.
B. Median transition time required for 50% transition of blastospores to hyphae (TT 50) of wild‐type, complemented and ▵MrMsn2 mutants was compared. TT 50 was calculated using a probit analysis with the SPSS program. Error bars are standard error. * P < 0.05, ** P < 0.01, significantly different compared with wild type.
