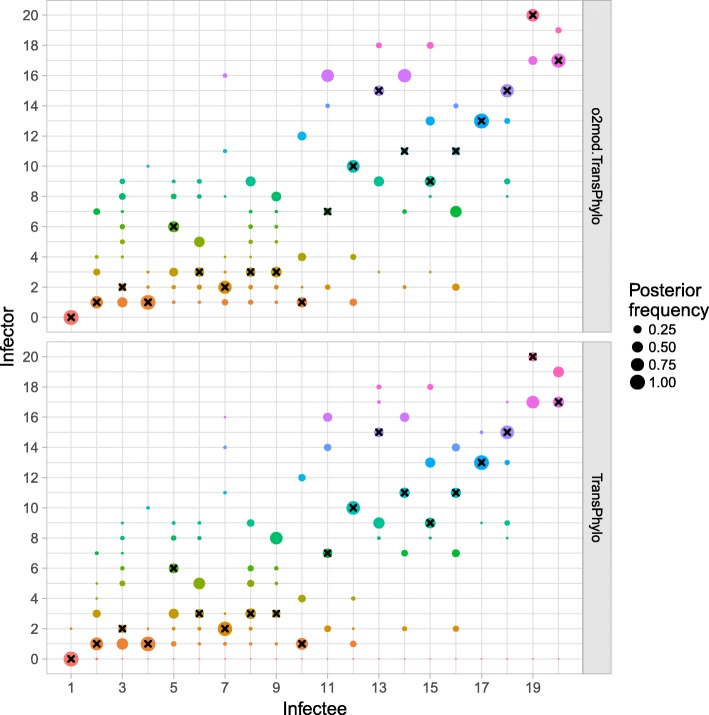
Fig. 3.
Posterior distribution of ancestry assignments using o2mod.TransPhylo and the original TransPhylo package. The size of each circle indicates the frequency of a given individual (“infector”) in the posterior distribution of infectors for a given case (“infectee”). An infector of 0 (bottom row) indicates that the individual is the index case. Black crosses represent the true simulated ancestries

