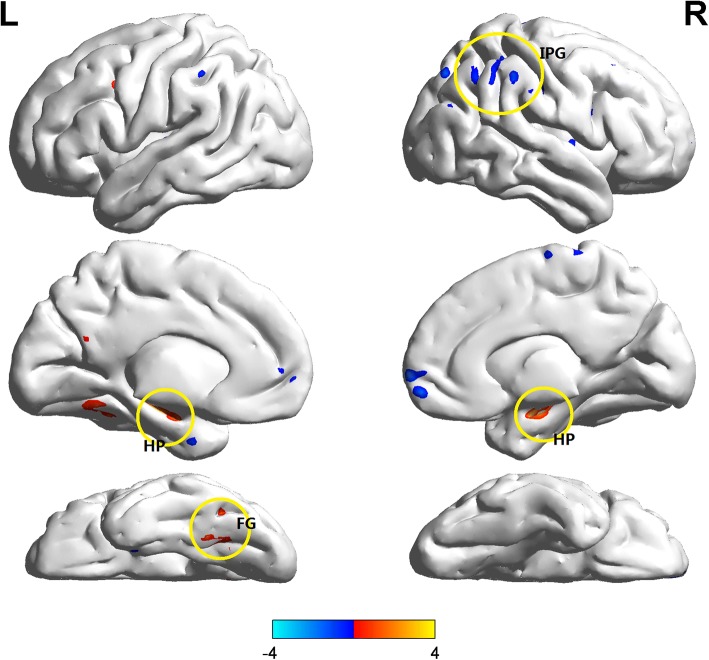
Fig. 1.
Shows the DC differences between SMC individuals and controls. SMC individuals showed higher DC (hot color) in the bilateral HP, left fusiform gyrus and lower DC (cold color) in the right inferior parietal region than controls (P<0.001, cluster size > 10 voxels, uncorrected, covariates including age, gender, education and geriatric depression scale). Abbreviations: DC degree centrality, SMC subjective memory complaint, HP hippocampus, IPG inferior parietal region

