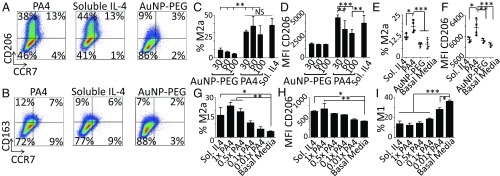
Fig. 3.
PA4 directed M2a Mφ polarization. (A and B) THP-1 derived Mφs were treated for 3 d with 20 ng/mL IL-4 as 30-nm PA4 or soluble IL-4 or 30-nm AuNP-PEG. Plots show expression of the M2a (CD206) or M2c (CD163) vs. the M1 marker (CCR7). (C) Percentage of M2a (CCR7−/CD163−/CD206+) Mφs. (D) CD206 median fluorescent intensity (MFI) within the CD206+ gate. (E and F) Mφs were treated for 1 d with 20 ng/mL IL-4 as 30-nm PA4 or soluble IL-4, AuNP-PEG, or basal RPMI. On day 5, flow cytometry was used to quantify M2a (CCR7−/CD206+) Mφs. (F) CD206 MFI within the CD206+/CCR7− gate. Data are means ± SD, n = 4. *P < 0.05; **P < 0.01; ***P < 0.001; NS, not significant. (G–I) Mφs were treated with 20 ng/mL IL-4 as soluble IL-4 or PA4 with varying degrees of IL-4 conjugation, 1×, 0.5×, 0.1×, and 0.01× (relative to the PA4s used throughout the work). (G) Flow cytometry was used to quantify M2a (CD206+/CCR7−) Mφs. (H) CD206 MFI within the CD206+ gate. (I) Percentage of M1 (CD206−/CCR7+) Mφs. Data are means ± SEM, n = 4. *P < 0.05; **P < 0.01; ***P < 0.001 (Dunnett’s comparison vs. basal media control).

