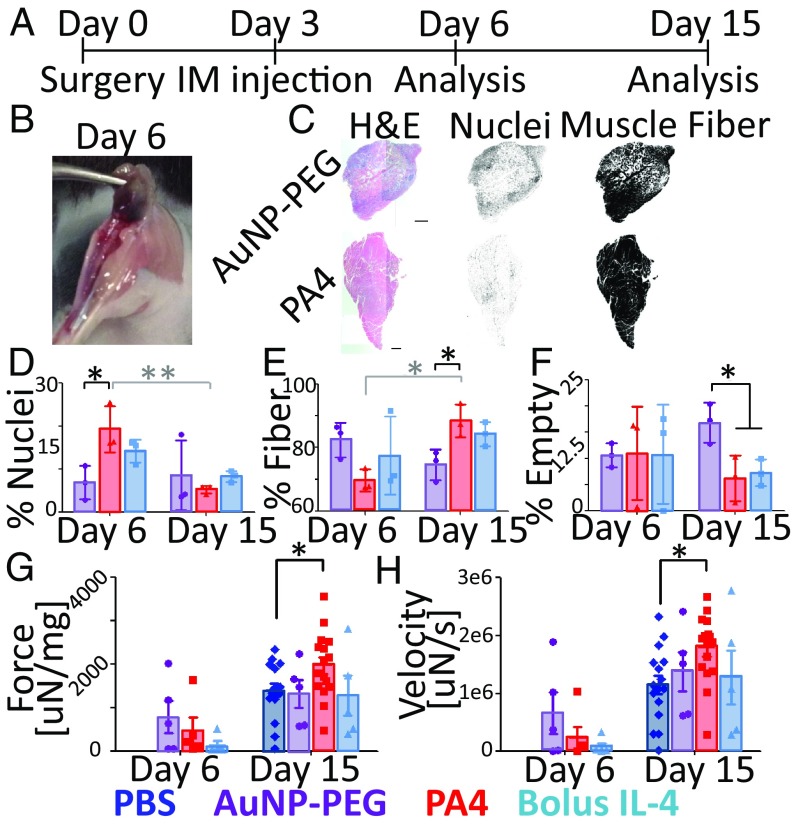
Fig. 4.
PA4 enhanced muscle fiber regeneration and contraction force following ischemic injury. (A) Timeline showing surgery, treatment, and TA analysis. (B) Representative image showing the purple hue of AuNPs throughout the TA on day 6. (C) Representative H&E of ischemic TAs on day 15 hematoxylin (Center) and eosin (Right) channels. (Scale bars, 1.5 mm.) (D–F) Percentage of the TA cross-section associated with cell nuclei, muscle fibers, or empty area. Data are means ± SD, n = 3. *P < 0.05; **P < 0.01. Due to large variations in empty area on day 6, these data were excluded from statistics. (G and H) Maximum contraction force (25 V, 250 Hz) and velocity. Force was normalized to TA mass. Data are means ± SEM. Day 6, n = 5; day 15, n = 16 for PA4 and PBS, n = 5 for AuNP-PEG and bolus IL-4. *P < 0.05 (Bonferroni planned comparison).

