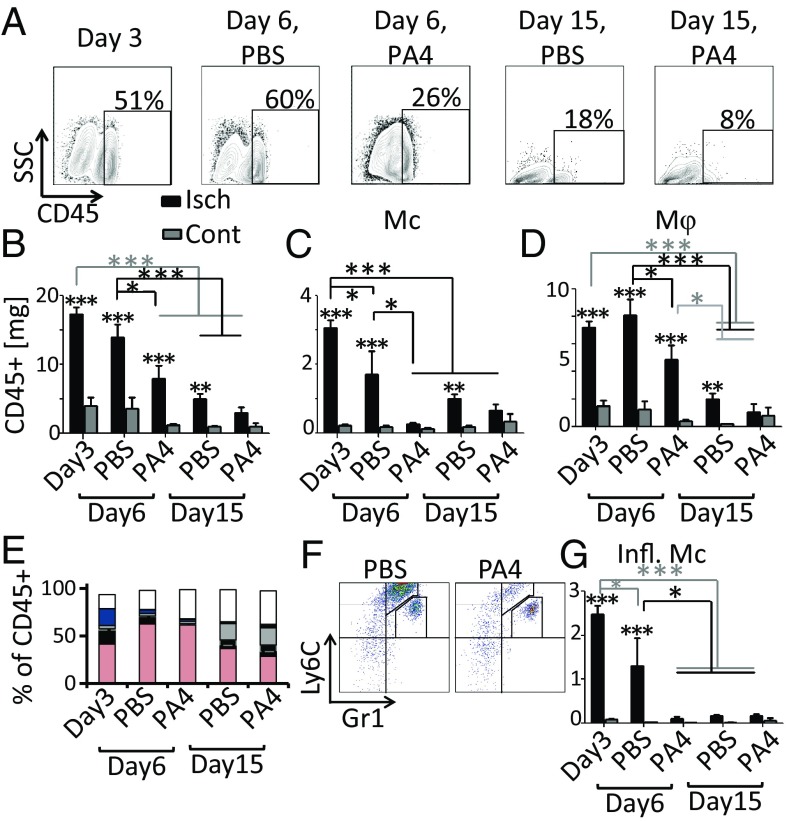
Fig. 5.
Immune cells are cleared more rapidly following PA4 treatment. (A) Plots show the percentage of TA cells that were CD45+. (B–D) CD45+, Mcs (CD45+/CD11b+/CD3−/F4/80−/Gr1lo or-), and Mφs (CD45+/CD11b+/CD3−/F4/80+) data normalized to TA mass (milligrams). (E) Distribution of CD45+ cells in the TA: Mφs (pink; CD11b+/CD3−/F4/80+), inflammatory Mcs (black; Ly6CHi/Gr1Lo), Mcs (black above gray border; Ly6CHi/Gr1−), patrolling Mcs (gray; Ly6CLo or-/Gr1−), neutrophils (blue; Ly6CLo/Gr1Hi), T cells (gray above the blue; CD3+), and CD11b−/CD3− (white). (F) Gating of myeloid (CD45+/CD11b+/CD3−/F4/80−) cells on day 6. Plots show diminishing inflammatory Mcs (Ly6CHi/Gr1Lo) with PA4 treatment. (G) Inflammatory Mcs (CD45+/CD11b+/CD3−/F4/80−/Gr1Lo/Ly6CHi) in TA normalized by mass (milligrams). Data are means ± SEM, n = 5–10. *P < 0.05; **P < 0.01; ***P < 0.001. Asterisks above columns indicate significance vs. contralateral. Cont, contralateral; Isch, ischemic.

