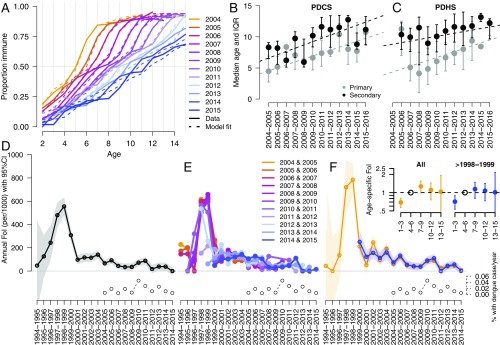
Fig. 2.
Age at DENV infection in the PDCS and PDHS and estimates of the FoI of DENV in the PDCS. (A) Age-stratified seroprevalence from 2004 to 2015 in the PDCS (shown as thick lines) and the estimates of seroprevalence based on the model with best performance (annual + age model with five age groups, shown as dotted lines). (B and C) Median and interquartile ranges for primary and secondary dengue cases by year in the PDCS (B) and the PDHS (C). Linear regression lines show the relationship of age at primary and secondary dengue across years. All regression models had slopes statistically significantly different from 0 at P < 0.001. (D) Estimates of annual FoI of DENV and 95% confidence intervals based on the annual only FoI model applied to PDCS age-stratified seroprevalence data. (E) Estimates of annual FoI of DENV based on fitting age-stratified seroprevalence data from only 2 y of the PDCS per model. The years used for each model are indicated in the legend. (F) Estimates of the annual and age-specific FoI of DENV based on models that provided the best fit (SI Appendix, Tables S3 and S4) of age-stratified seroprevalence data from all children (orange lines) or only those born after 1998–1999 (blue lines). The percentage of the PDCS subjects who experienced dengue (includes all symptomatic DENV infections) each epidemic season is indicated in the bottom right corners of D–F.

