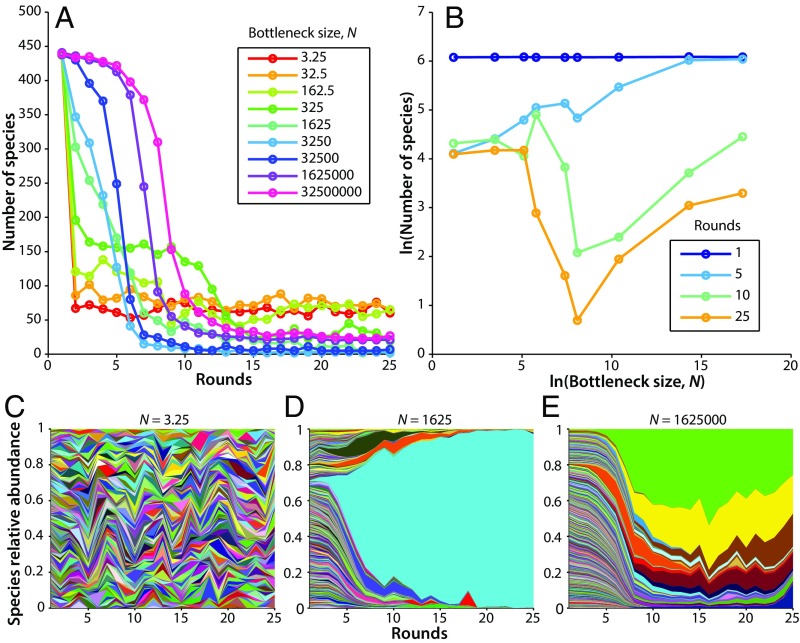
Fig. 2.
Experimental time dynamics. Immigration is ∼55 cells per round for each experiment. (A) Number of species detected over time for a range of dilutions. (B) Species area curves over time. (C–E) Muller plots showing the relative abundance of all 456 strains over time in three different experiments. Each species is represented by a different color, whereby the proportion of each color represents the relative abundance of that species. Color/species pairings are consistent from plot to plot. Bottleneck was 3.25 cells per round in C; 1,625 cells per round in D; and 1,625,000 cells per round in E.

