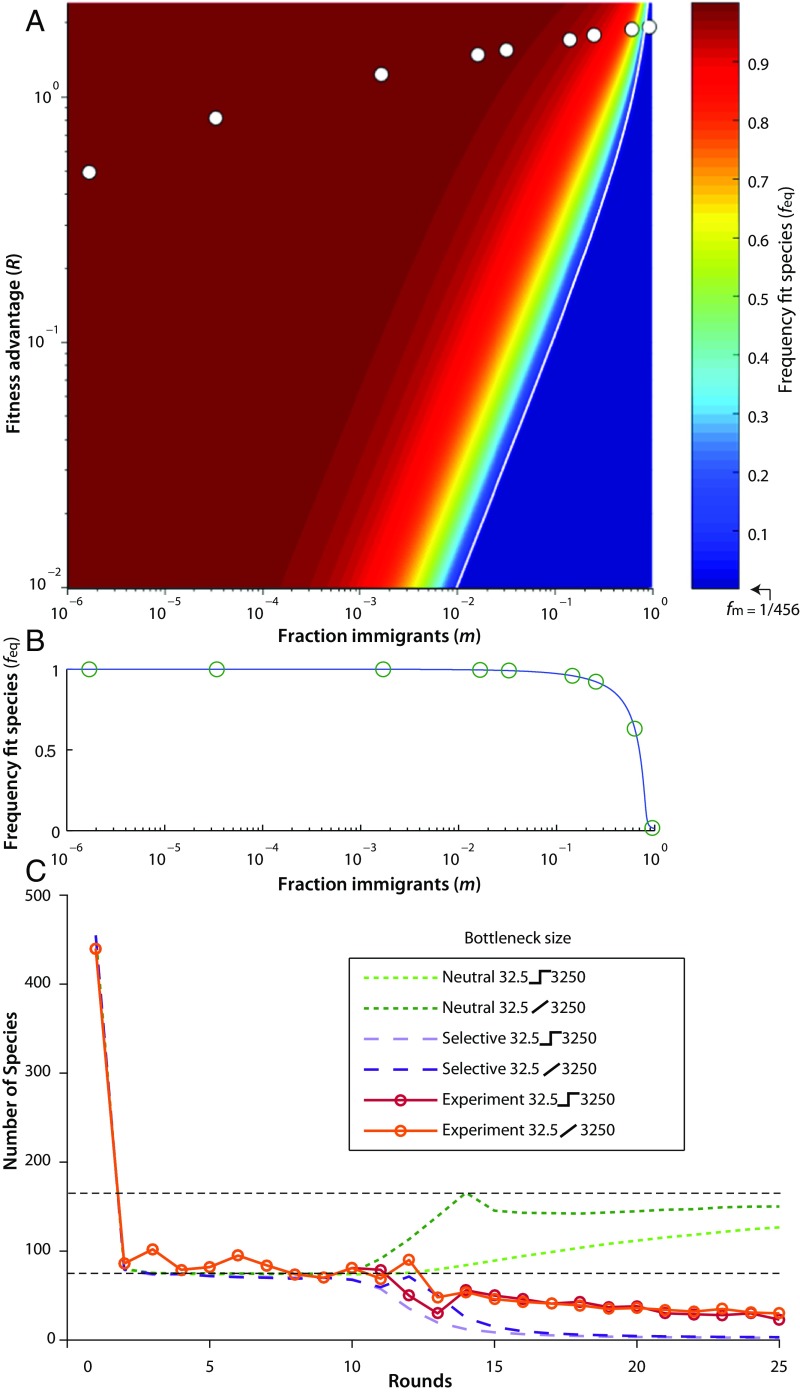
Fig. 4.
Transition from selective to neutral. (A) Phase space of equilibrium frequency (feq) of a single-fit clone in a neutral background as a function of per-round relative fitness (R) vs. fraction of immigrants (m). Points indicate the experimentally investigated region, and bottleneck size decreases from left to right (assuming a maximum per-replication relative fitness of 8.5%). The immigration fraction of any species is, . The white line indicates the R = δ threshold. (B) A slice through the phase space along the experimentally tested conditions. A transition is predicted: At high immigrant fraction, fit clones do not rise to high abundance and the system is neutral; and at the low immigration fraction, the fit species dominates the population and causes departure from neutrality. Each circle indicates the theoretical prediction for feq. (C) Community recovery. Here, a community is maintained at a bottleneck size of 32.5 for 10 rounds and then the bottleneck is allowed to expand to 3,250. The recovery took the form of either a step function or a gradual expansion. Although both models predict a similar number of species to the experimental community before recovery (lower horizontal dashed line), the neutral model (green lines) makes drastically different predictions than a selective model (purple lines) after recovery. The neutral model predicts that the number of species in the community will increase to the new equilibrium level (upper horizontal dashed line), with the recovery happening much slower for the step function (light-green dashed line) than the gradual increase (dark-green dashed line). The selective model predicts that the community will lose diversity independent of step (lavender dashed line) or gradual recovery (purple dashed line). In both the step (solid red line) and gradual recovery (solid orange line) the experimental communities lost diversity.

