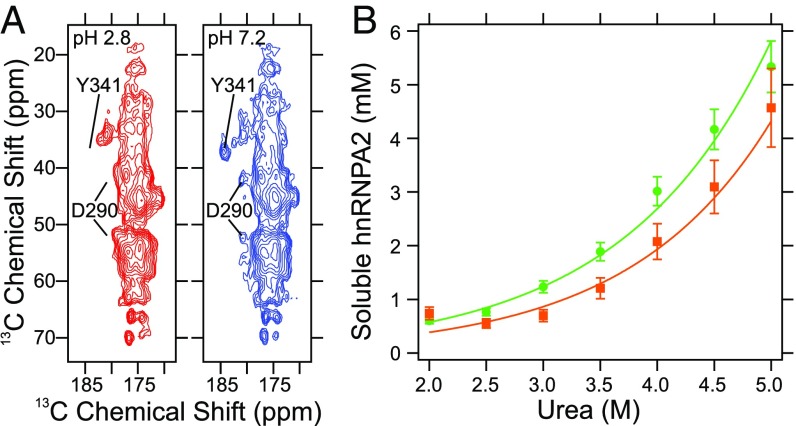
Fig. 5.
Charge state of the D290 side chain and polymer thermodynamic stability. (A) Carbonyl/carboxylate region of a 2D 13C-13C DARR solid-state NMR spectrum of mCherry-hnRNPA2-LC polymers. Red and blue contours are spectra of samples at pH 2.8 and 7.2, respectively. Locations of the D290 and Y340 cross-peaks at pH 7.2 are indicated in both spectra. (B) Soluble GFP-hnRNPA2-LC concentrations after wild-type (green circles) and D290V mutant (orange squares) polymers were exposed to urea for 21–22 h. Color-coded lines are a simultaneous fit to the data assuming the polymers are at equilibrium with monomeric soluble protein and a linear dependence of polymer stability on urea concentration.

