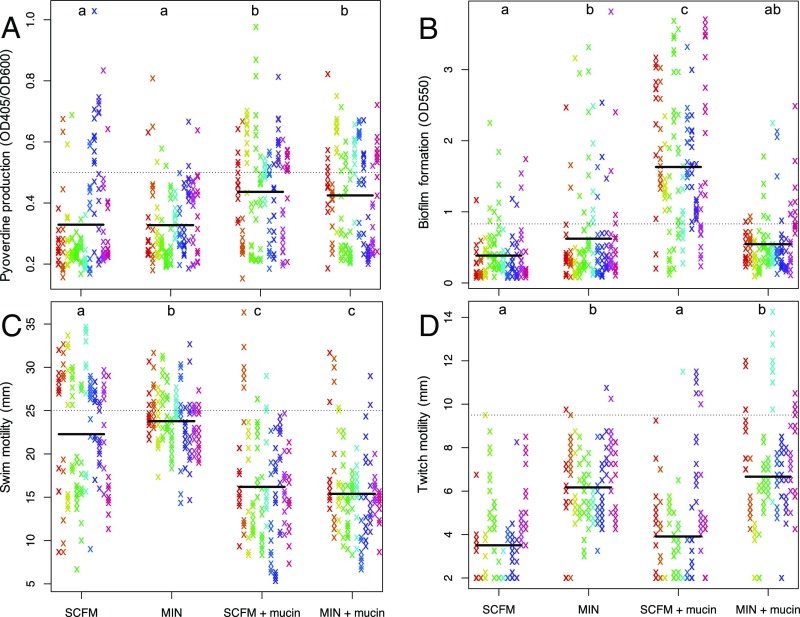
Fig. 1.
Phenotypic adaptation of evolved isolates for pyoverdine production (A), biofilm formation (B), swim motility (C), and twitch motility (D). Within each treatment, each column/color represents a replicate evolved population (n = 12 populations for each treatment). Solid lines represent treatment means, and dashed lines represent the value of that phenotype in the ancestral strain (Pa14).

