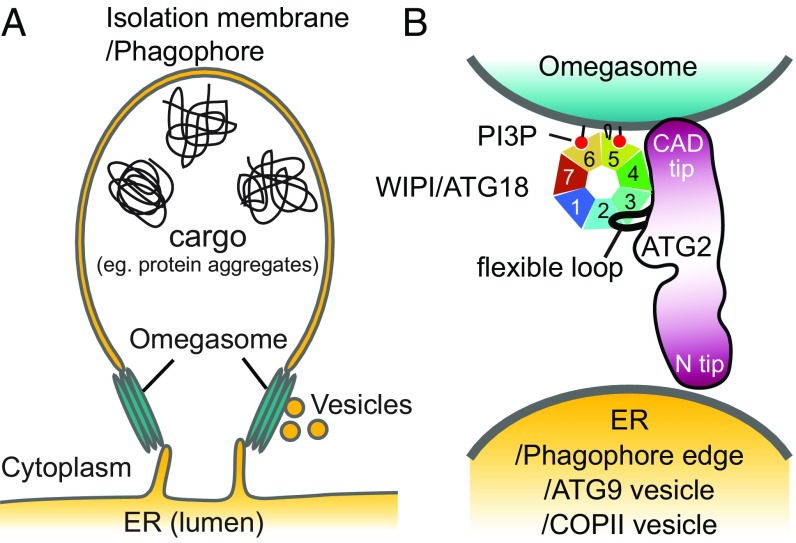
Fig. 8.
Proposed models of the ER-phagophore/isolation membrane association mediated by the ATG2-WIPI/ATG18 complex. (A) Illustration of the ER–phagophore junction based on current knowledge from cell biological studies. Each gray line represents a lipid bilayer. (B) Structural model of the ATG2-WIPI/ATG18 complex tethering the omegasome to its neighboring membranes (ER, phagophore edge, ATG9 vesicle, or COPII vesicle). The dark red color of ATG2 represents conserved regions as in Fig. 2A. The WIPI/ATG18-binding region of ATG2 is represented as a black line emanating from the middle region of ATG2 to indicate the flexible attachment of WIPI/ATG18.

