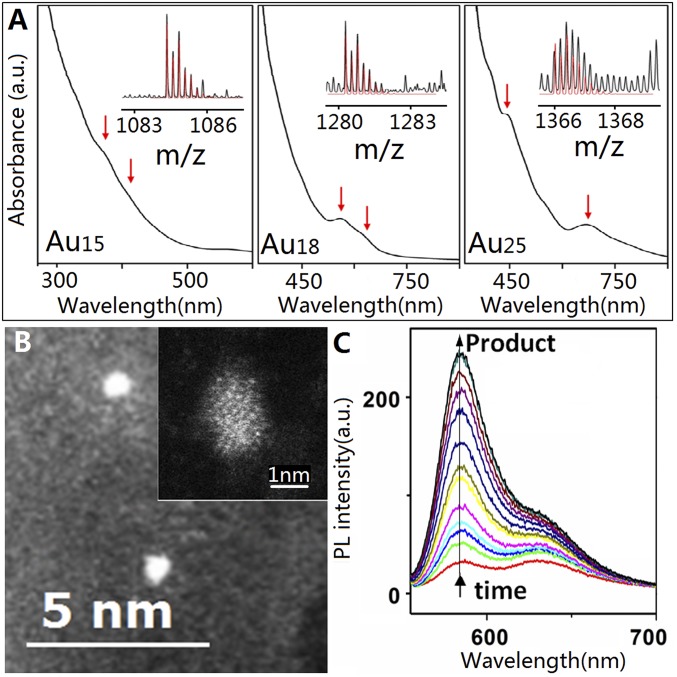
Fig. 1.
Characterization of Au clusters. (A) UV-Vis absorption spectra and ESI-MS spectra (black lines in Insets) of the as-synthesized Au15 (Left), Au18 (Middle), and Au25 (Right) clusters; the red arrows indicate characteristic absorption peaks of the corresponding Au nanoclusters. The red lines in the Insets are the simulated isotope patterns of [Au15(MPA)13 − 5 H + Na]4−, [Au18(MPA)14 − 9 H + 5 Na]4−, and [Au25(MPA)18 − 7 H + Na]5−. (B) Typical TEM image of Au25 clusters. (Inset) Typical high-angle annular dark-field imaging–TEM image of one Au25 cluster. (C) Fluorescence spectra of resazurin reduction by NH2OH catalyzed by Au25 clusters (λex = 532 nm; [resazurin] = 10 µM; [NH2OH] = 20 mM). The arrow indicates fluorescence increase of the product with time.

