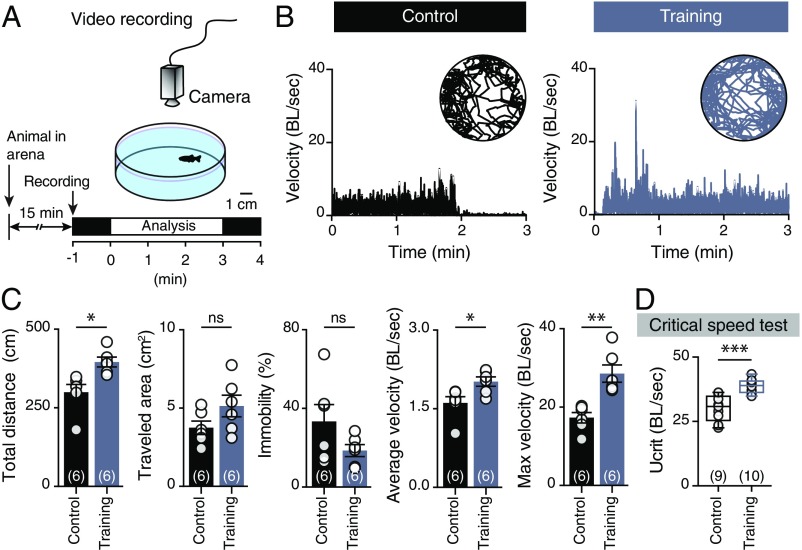
Fig. 3.
Trained animals can swim faster. (A) Experimental design to investigate locomotor behavior of control and trained animals in an open field test. (B) Representative traces of the recorded animals’ movements during the open field test and analysis of their normalized velocity (BL per s). (C) Quantification of the motor behavior parameters: maximum velocity (P = 0.0014, unpaired t-test), average velocity (P = 0.022, unpaired t-test), and total distance traveled (P = 0.0106, unpaired t-test). (D) Trained animals can swim faster than the control animals during critical speed tests (P = 0.0002, unpaired t-test). Speed is normalized (BL per s). Data are presented as mean ± SEM (C) and boxplots showing the median and 25th and 75th percentile (box and line) and minimal and maximal values (whiskers in D). *P < 0.05; **P < 0.01; ***P < 0.001; ns, not significant. For detailed statistics see SI Appendix, Table S1.

