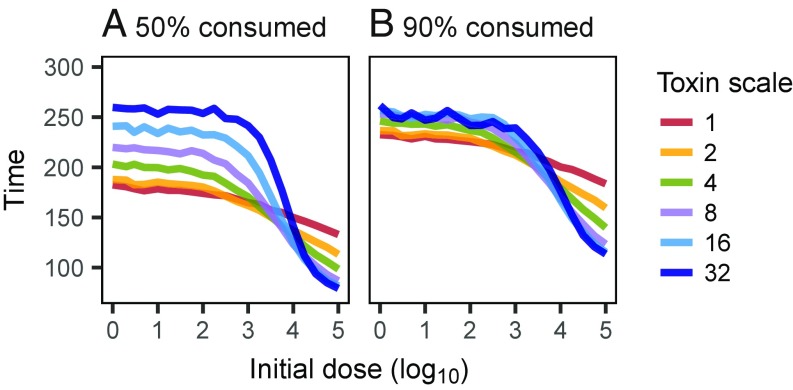
Fig. 4.
(A and B) Progression of the infection as a function of the initial dose and the mode of action (toxin movement scale). The plots show the mean time until 50% (A) and 90% (B) of the initial tissue are consumed (with inoculation radius ), averaged over replicates where the infection spreads as far.

