Fig. 3.
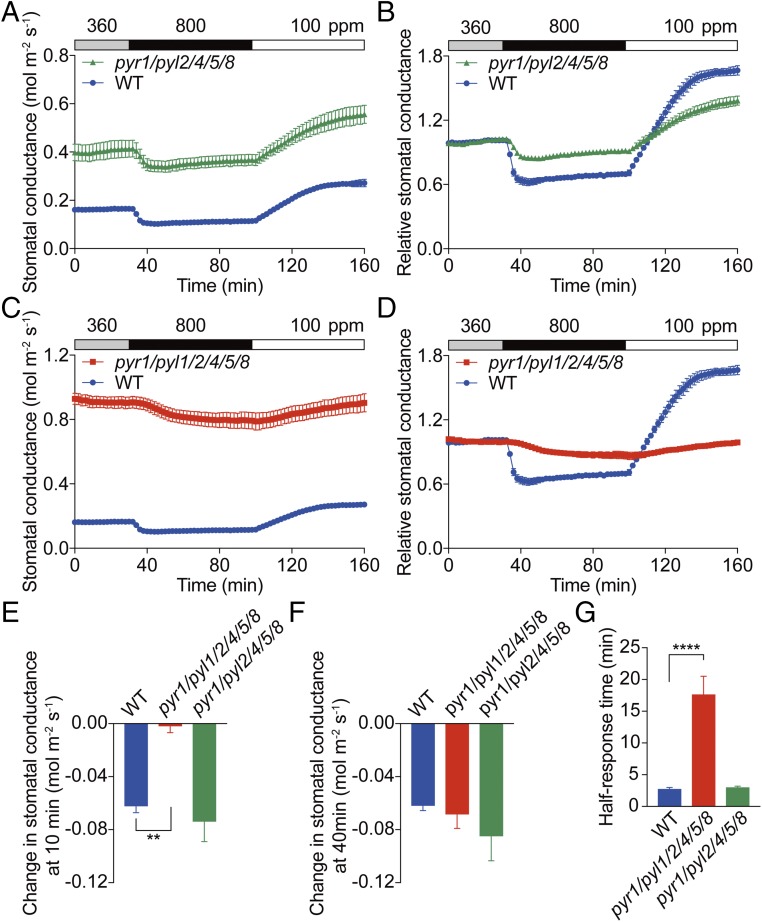
Stomata of ABA receptor quintuple and hextuple mutants show attenuated stomatal conductance responses to CO2 concentration changes. Time-resolved stomatal conductance responses to changes in [CO2] in Col-0 (WT), pyr1/pyl2/pyl4/pyl5/pyl8 (rcar3/8/10/11/14) quintuple mutant (pyr1/pyl2/4/5/8), and pyr1/pyl1/pyl2/pyl4/pyl5/pyl8 (rcar3/8/10/11/12/14) hextuple mutant (pyr1/pyl1/2/4/5/8) leaves. CO2 concentrations are shown on top of the data traces in each panel. (A) Absolute average stomatal conductances of WT and pyr1/pyl2/4/5/8 quintuple mutant leaves. (B) The corresponding relative stomatal conductance responses shown in A. (C) Absolute stomatal conductance of WT and pyr1/pyl1/2/4/5/8 hextuple mutant leaves. (D) The corresponding relative stomatal conductance responses shown in C. Relative stomatal conductances were calculated by normalizing to the average stomatal conductance at 360 ppm CO2. Note that data from WT leaves in A and C are the same because the data were obtained in the same experimental dataset. Absolute reduction in stomatal conductance after switching from 360 to 800 ppm CO2 for (E) 10 min or (F) 40 min. (G) Average half-response times to 800 ppm CO2. WT controls are the same because mutants and WT were analyzed in parallel. n = 5 plants for WT, n = 4 plants for pyl1/pyl2/4/5/8, and n = 4 plants pyl1/pyl1/2/4/5/8. Data represent mean ± SEM. **P < 0.01, ****P < 0.0001 as analyzed by one-way ANOVA followed by a Dunnett’s test compared with WT control. Data represent one of three independent sets of experiments showing similar results.

