Fig. 6.
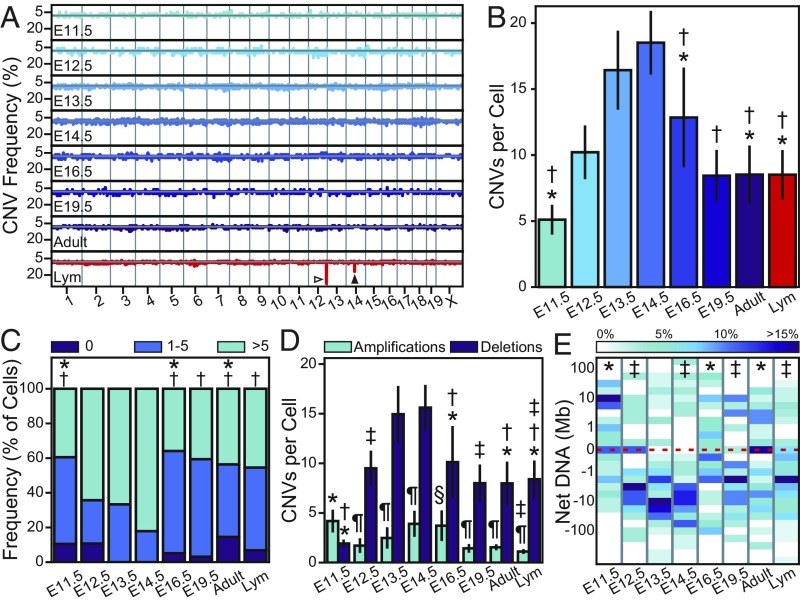
CNVs are generated and developmentally varied during cortical neurogenesis. (A) The frequency with which each genomic locus is affected by an amplification (above the gray line) or deletion (below the gray line) event. The Ig heavy chain and TCR α chain are indicated by open and closed arrowheads, respectively. (B) The number of CNVs per cell increases through E14.5. (C) The proportion of cells containing 0, moderate (≤5), or extreme CNV numbers. (D) Amplification and deletion events per cell showing a preference for DNA loss. (E) Heatmap of net DNA change per cell. The dashed line indicates 0, an equal quantity of DNA amplified and deleted. All error bars show SEM; sample sizes are listed in Table 1; *P < 0.05 vs. E13.5; †P < 0.01 vs. E14.5; ‡P < 0.01 vs. E11.5; §P < 0.01 vs. Lym; ¶P < 0.001 vs. deletions.

