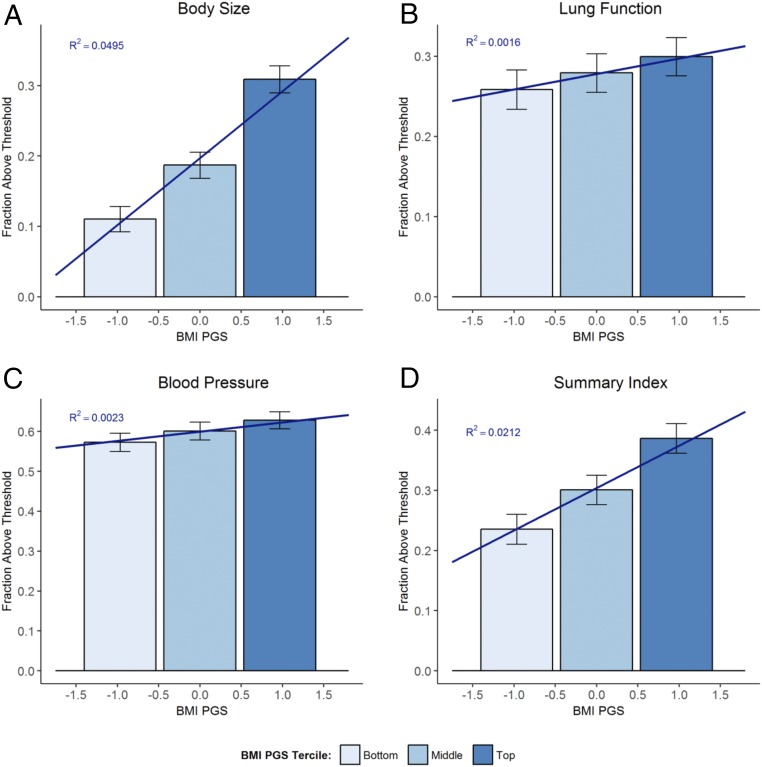
Fig. 1.
Health differences by BMI PGS. Bars show means of binary measures of body size (A), lung function (B), blood pressure (C), and summary indices (D) for the bottom, middle, and top terciles of the BMI PGS distribution with 95% confidence intervals. Bars are centered at the median PGS value in the tercile. Sloped lines give linear projection of outcomes on the BMI PGS. R2 gives the fraction of the variation in the outcome explained by the BMI PGS. To make estimates comparable to our estimates in Fig. 3, we restricted the sample to participants who were born before September 1, 1957, and who dropped out before age 16 and controlled for a quadratic polynomial in date of birth.

