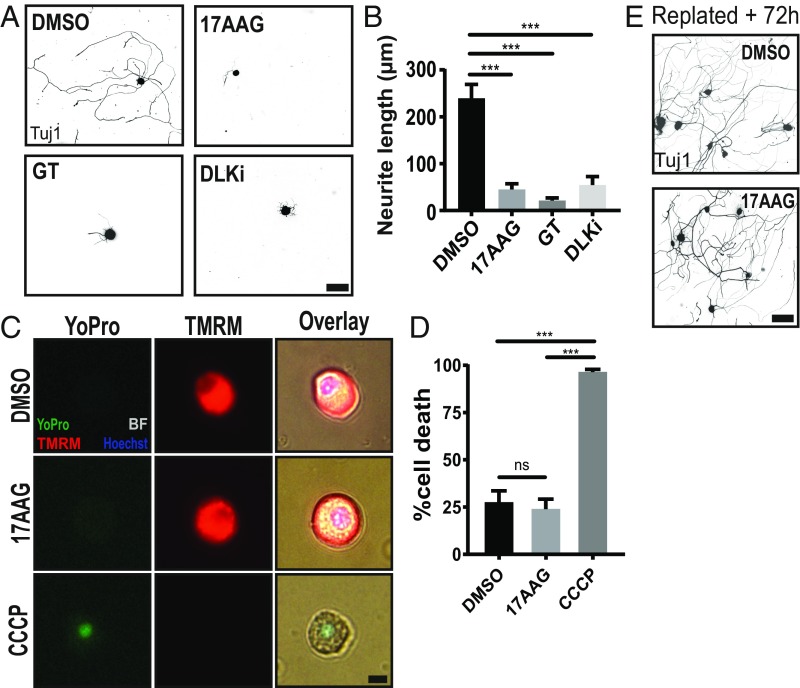
Fig. 2.
HSP90 inhibitors potently block induction of the axon regeneration program. (A) Low-throughput manual replating assay with the top screen hit 17AAG (1 µM), a structurally different HSP90 inhibitor (15 nM GT), and 500 nM DLK inhibitor GNE-3511 (DLKi). (Scale bar, 100 µm.) (B) Quantification of A (mean ± SEM). Data represent the mean length of the longest neurite per cell. Within each experiment, two technical replicates (∼100 cells each) were averaged to yield one biological replicate: n = 3–8 independent experiments, one-way ANOVA with Tukey’s multiple comparisons, DF = 23, F = 16.2. ***DMSO vs. 17AAG P < 0.0001; ***DMSO vs. GT P < 0.0001; ***DMSO vs. DLKi P = 0.0008. (C) Adult DRG neurons cultured for 24 h in the presence of DMSO, 1 µM 17AAG, or 50 µM CCCP (positive control). Cells were loaded with the cell death marker, YoPro, and the mitochondrial potential dye, TMRM, before live imaging. (Scale bar: 10 µm.) (D) Quantification of C (mean ± SEM). A dead cell was defined as YoPro positive and TMRM negative: n = 3 independent experiments each with 100 cells, one-way ANOVA with Tukey’s multiple comparisons, DF = 8, F = 75.3. ns, DMSO vs. 17AAG P = 0.86. ***DMSO vs. CCCP P = 0.0001; ***17AAG vs. CCCP P < 0.0001. (E) Neurons pretreated with DMSO or 1 µM 17AAG for 24 h and replated normally but given 72 h to grow neurites rather than 18 h. (Scale bar: 100 µm.) ns, not significant.

