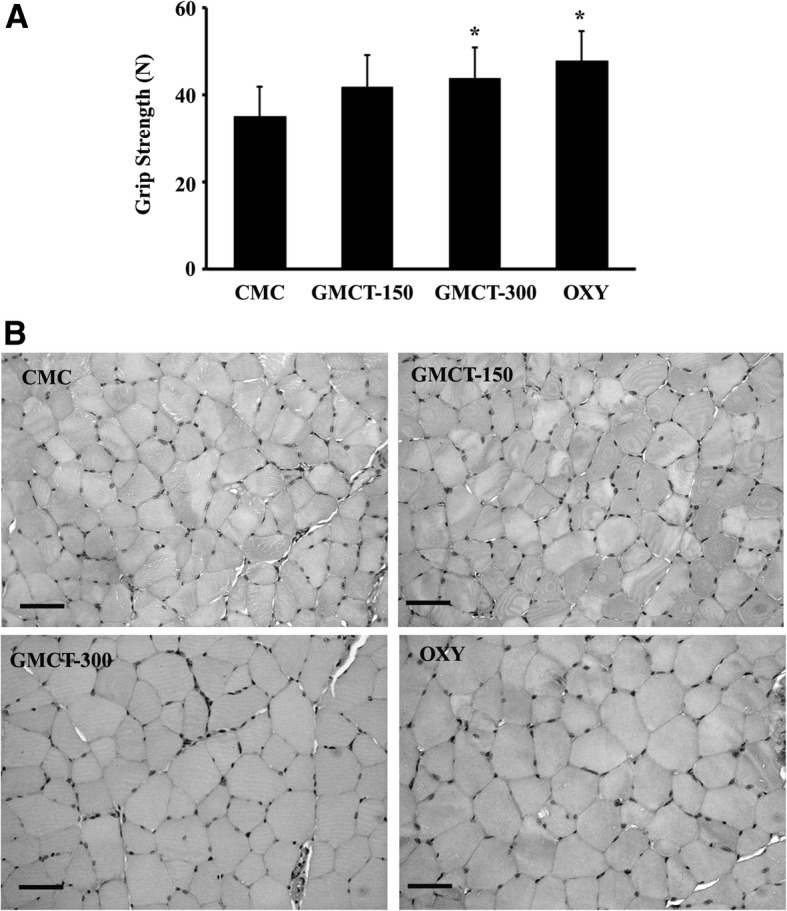
Fig. 4.

GMCT positively modulates muscle parameters in mice. The groups presenting CMC, GMCT-150, GMCT-300 and OXY are described in Methods. a Bar diagram represents the change in grip strength in experimental animals (n = 6). Each bar represents mean ± SD of strength in Newton per gram of body weight as mentioned in Results. *p < 0.05 compared with the vehicle control group (CMC), using unpaired t-test. b Representative photomicrographs show Hematoxyline-Eosin stained cross-sections of the gastrocnemius muscles of the different group of animals, as indicated. Bar indicates 50 μm
