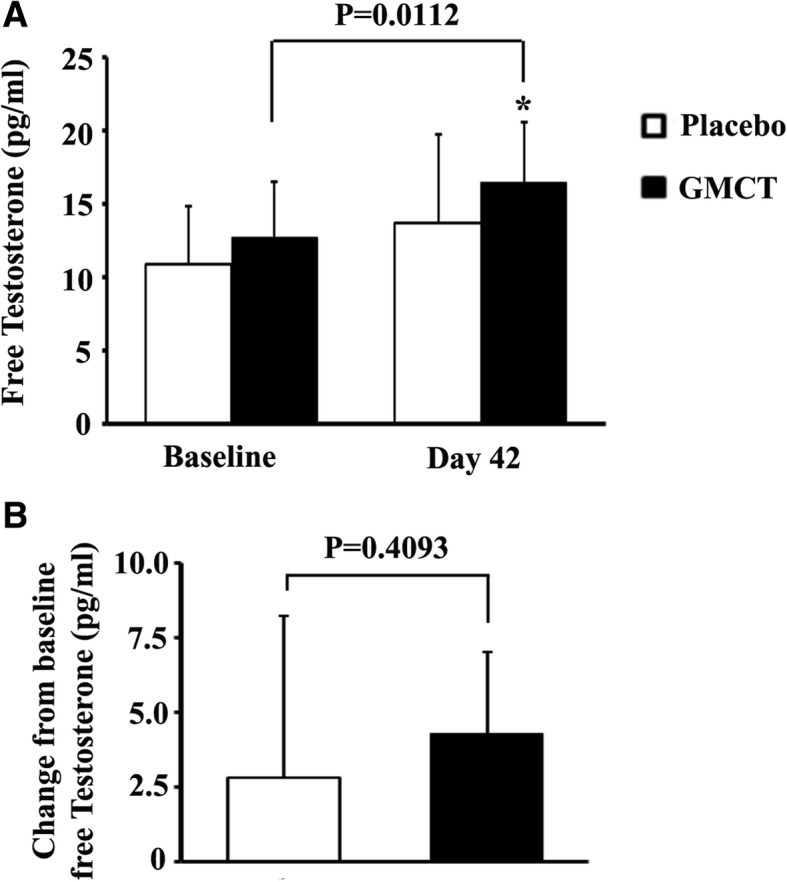
Fig. 6.

Effect of GMCT supplementation on free testosterone level in the circulation of resistance-trained participants. a Bars represent mean ± SD of free testosterone concentrations in placebo (n = 15) and GMCT (n = 16) groups at baseline and post-intervention. b Bars represent mean ± SD of changes from baseline free testosterone concentrations in placebo and GMCT groups at post-intervention. * indicates significance in an unpaired t-test
