
Figure 1.
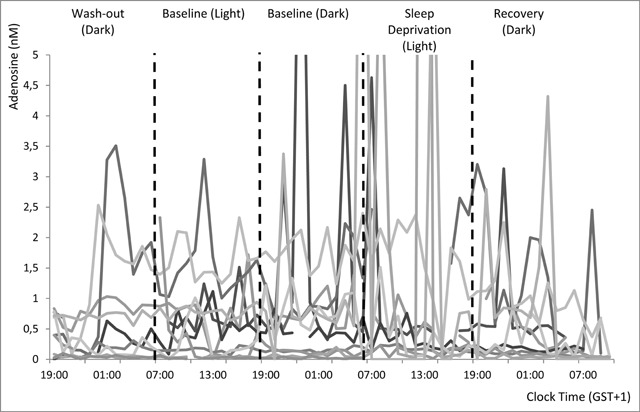
Individual adenosine concentration time curves in mPFC dialysate.
N = 11. The axis was stretched to 5 nM to decrease overlap and improve visibility of individual curves, this results in 5 high values (10.0; 12.9; 7.3; 27.0; and 7.5 nM) being off the chart.