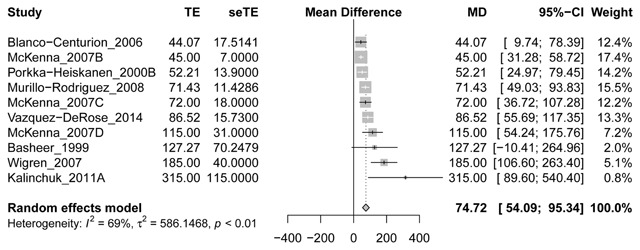
Figure 4.

Forest plot and meta-analysis of changes in basal forebrain microdialysate adenosine concentrations during sleep deprivation.
If papers provided multiple time points during sleep deprivation, we selected the last for the analyses. McKenna B, C and D refer to experimental groups exposed to different sleep deprivation protocols within the same paper (group A comprised measurements in the nucleus accumbens, not included in our meta-analyses). MD = Mean Difference (% over baseline); CI = Confidence Interval.
