
Figure 5.
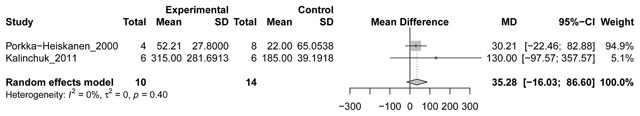
Forest plot and meta-analysis of differences between basal forebrain and cortex in changes from baseline microdialysate adenosine concentrations during sleep deprivation.
If papers provided multiple time points during sleep deprivation, we selected the last for the analyses. MD = Mean Difference (% over baseline); CI = Confidence Interval.