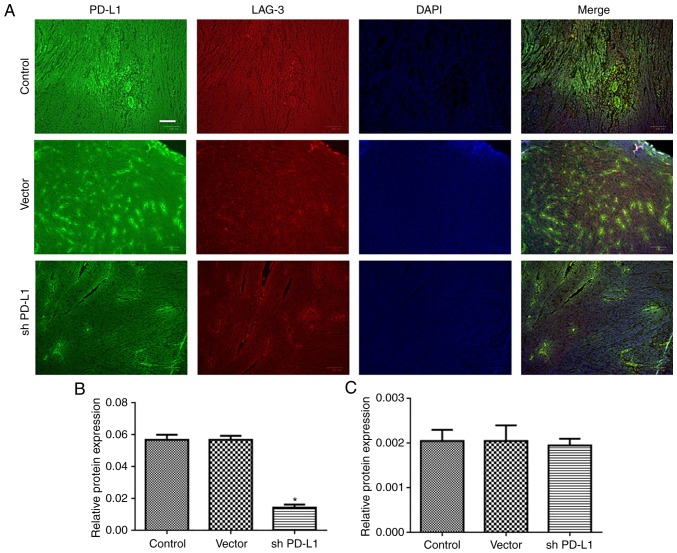
Figure 4.
PD-L1 expression is reduced in the inoculated tumors. (A) Representative images of PD-L1 and LAG-3 expression. Scale bar, 100 µm. (B) Quantification data of PD-L1 expression showing that PD-L1 expression was significantly reduced after transfection with shRNA PD-L1. (C) Quantification data of LAG-3 expression showing that LAG-3 expression was comparable in each group. *P<0.05 vs. control. (One-way analysis of variance with Newman-Keuls). PD-L1, programmed cell death ligand 1; LAG3, lymphocyte-activating gene 3.

