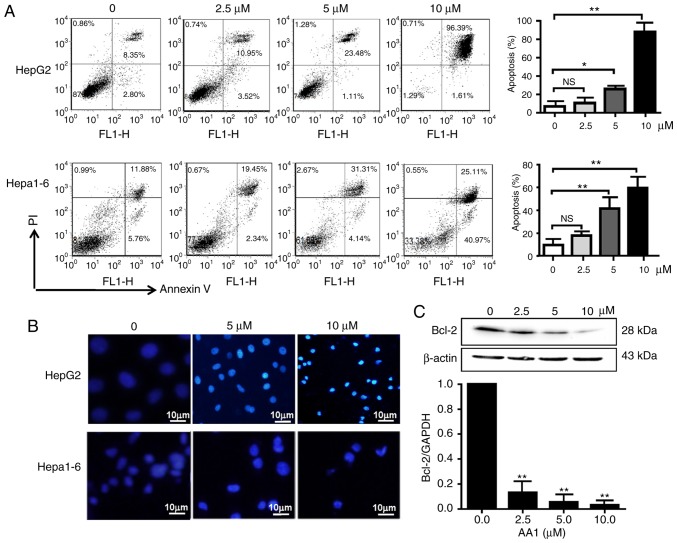
Figure 2.
Inhibition of thioredoxin reductase induces apoptosis in liver cancer cells. HepG2 and Hepa1-6 cells were treated with AA1 for 12 h. (A) The percentage of cells undergoing apoptosis was determined by flow cytometry using an Annexin V/PI assay. (B) HepG2 and Hepa1-6 cells treated with AA1 for 12 h were stained with DAPI. Images were acquired by fluorescence microscopy (scale bar 10 µm). (C) Expression of the anti-apoptotic gene Bcl-2 was assayed by quantitative polymerase chain reaction and western blotting following treatment by AA1 for 12 h. Data are expressed as the mean ± standard deviation of at least three independent experiments. *P<0.05 and **P<0.01 vs. the untreated group (0 µM). PI, propidium iodide; Bcl-2, B cell lymphoma-2; AA1, chloro(triethylphosphine)gold(I); NS, not significant.

