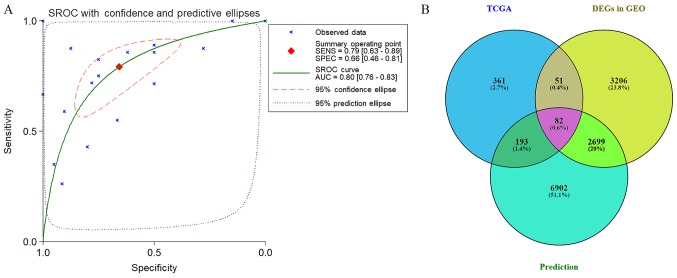
Figure 11.
(A) Combined sROC curve for the expression of miR-224-5p between PCa based on the overall microarray. (B) Venn diagram for the crossing potential target genes of miR-224-5p in PCa. sROC, summary receiver operating characteristic; AUC, area under the curve; SENS, sensitivity; SPEC, specificity; miR, microRNA; PCa, prostate adenocarcinoma; TCGA, The Cancer Genome Atlas; DEGs, differentially expressed genes; GEO, Gene Expression Omnibus.

