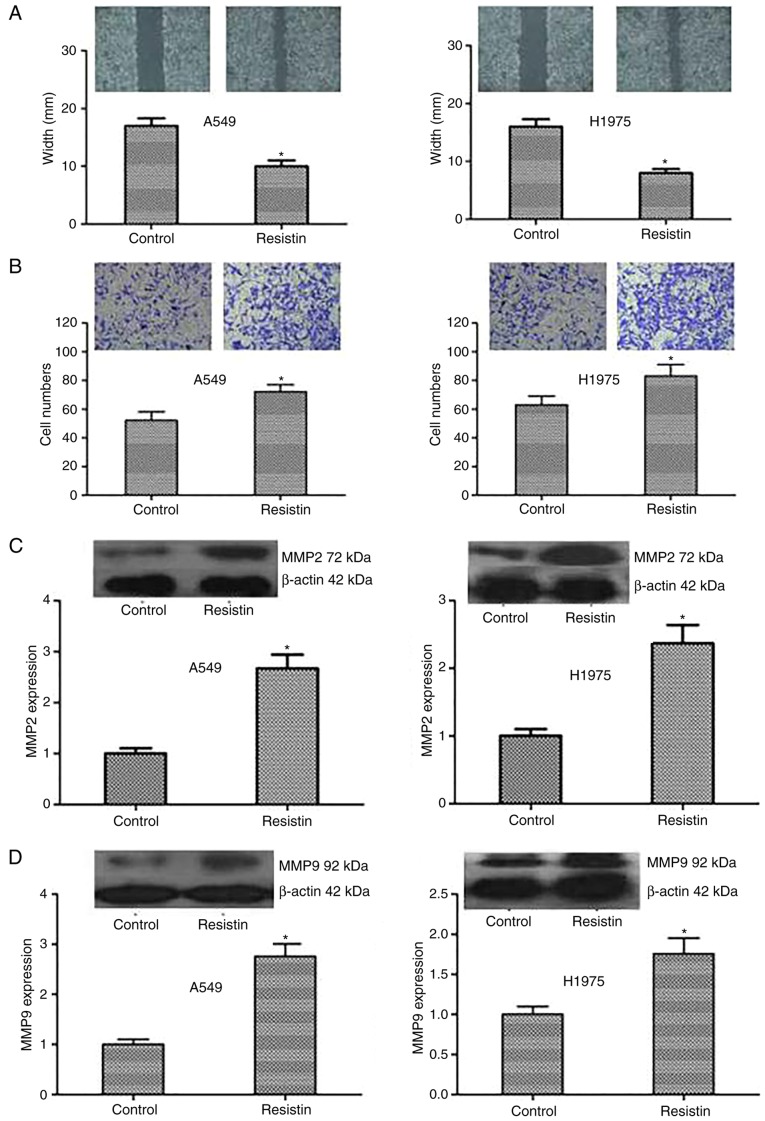
Figure 5.
Influence of resistin on the migration and invasion of A549 and H1975 cells. (A) A scratch assay demonstrated that the width in resistin group was decreased. (B) Transwell assay was used to measure the invasion of tumor cells. Compared with the controls, the number of cells within the lower chamber in resistin group was significantly increased (magnification, ×400). The results of western blot demonstrated that the expression of (C) MMP2 and (D) MMP9 proteins was upregulated in the resistin group. *P<0.05 vs. the control.

