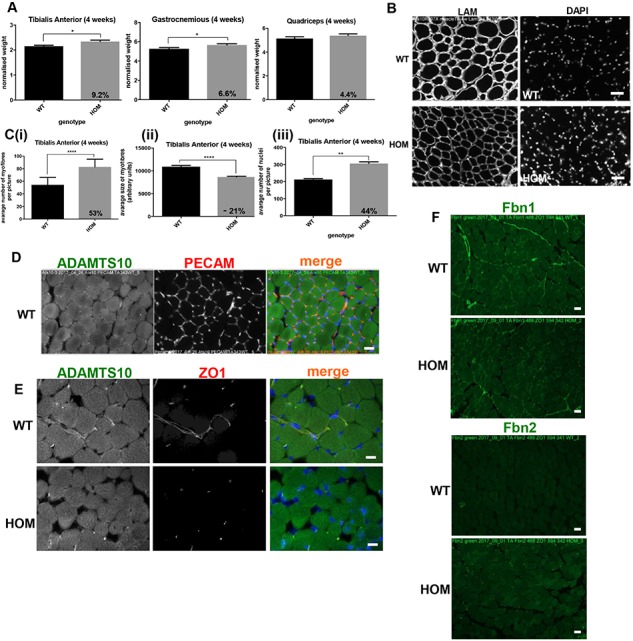
Figure 6.

ADAMTS10 in muscle niche and disruption of ZO-1 tight junctions. (A) Graphs representing normalized weight of the 4-week-old WT and HOM TA, Gastrocnemius (G) and Quadriceps (Q). (B) IF staining of laminin (LAM) and nuclei in the WT and HOM TA. (C) Quantification of (i) number and (ii) size of myofibres and (iii) number of nuclei in the 4-week TA, n ≥ 6. (D) IF staining of PECAM1 (red) and ADAMTS10 (green) in wild-type TA. (E) IF staining of ADAMTS10 (green) and tight junctions (ZO-1, red) in TA showing loss of the latter in HOM muscle. (F) IF staining of Fbn1 and Fbn2 (green) in TA showing presence of Fbn1 in both WT and HOM and Fbn2 in HOM muscle only, scale bars = 50 μm. Negative control images are shown in Supplementary Figure 5. Statistical significance was calculated using two-tail unpaired Student’s test in GraphPad Prism V6. Asterisk indicate P-values where *P-value ≤ 0.05; **P-value ≤ 0.01; ****P-value ≤ 0.0001.
