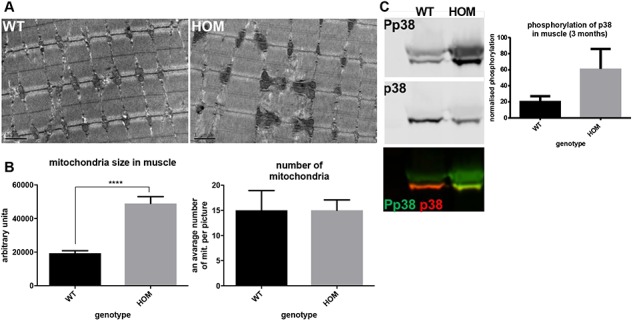
Figure 7.

Perturbed skeletal muscle homeostasis in WMS ADAMTS10S236X/S236Xmuscle. (A) TEM of the 3-month-old WT and HOM muscle tissue showing enlarged mitochondria in the latter, scale bar = 1 μm. (B) Quantification of size and number of mitochondria (one mouse 4 areas). (C) Western blots of phospho-p38 (Pp38) and p38 protein levels in the 4-week-old skeletal muscle lysates showing increased MAPK signalling in the WMS muscle. Normalized quantifications, n = 3. Statistical significance was calculated using two-tail unpaired Student’s test in GraphPad Prism V6. Asterisk indicate P-values where ****P-value ≤ 0.0001.
