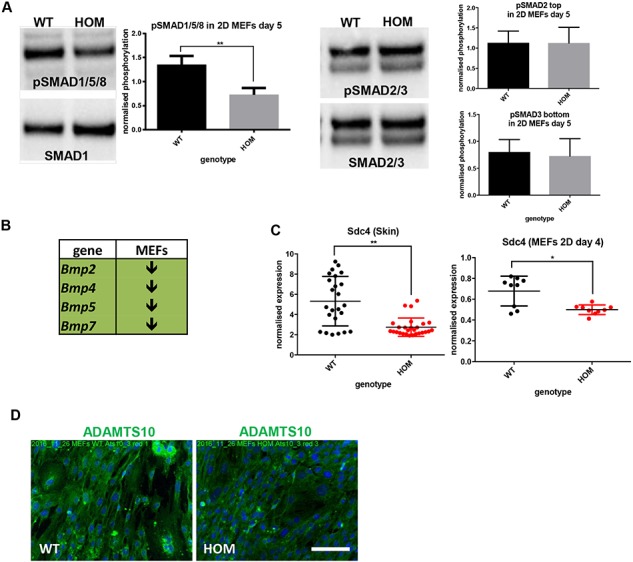
Figure 8.

Reduced BMP signalling and syndecan-4 expression in ADAMTS10S236X/S236X skin and MEFs. (A) pSMAD1/5/8, SMAD1 and pSMAD2/3, SMAD2/3 (the top band is (p)SMAD2 and the lower band (p)SMAD3) in MEFs isolated from the WT and HOM embryos cultured in 2D for 5 days. Normalized quantifications, n = 3. (B) RT-PCRs shows down-regulation of Bmp signalling in HOM 4 day 2D MEFs (experimental data shown in Supplementary Fig. 6). (C) RT-PCR data showing decreased syndecan-4 expression in both HOM 3-month-old mouse skin and 4 day 2D MEFs, n = 3. (D) IF microscopy of the WT and HOM MEFs cultured for 4 days and stained with ADAMTS10 (green) and DAPI (blue), negative staining controls are included in Supplementary Figure 8. Scale bar = 100 μm. Statistical significance was calculated using two-tail unpaired Student’s test in GraphPad Prism V6. Asterisk indicate P-values where *P-value ≤ 0.05; **P-value ≤ 0.01; ***P-value ≤ 0.001; ****P-value ≤ 0.0001.
