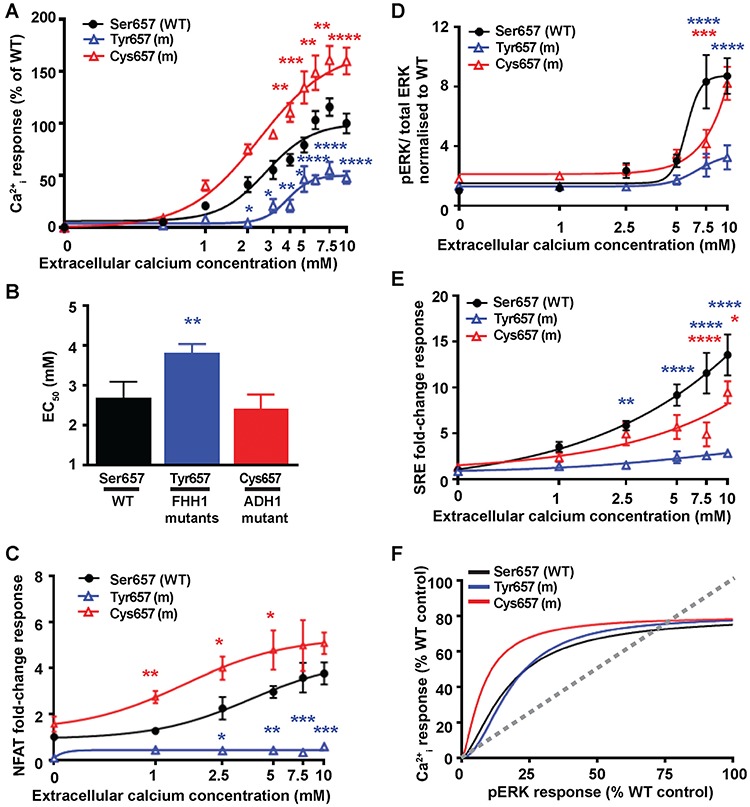
Figure 4.

Effect of the TMD Ser657 disease-switch residue mutations on Ca2+i and pERK signalling. (A) Concentration-response curves showing Ca2+i responses following stimulation with Ca2+e in HEK293 cells expressing WT (Ser657, black), or FHH1-associated (Tyr657, blue) or ADH1-associated (Cys657, red) mutant (m) CaSR proteins. Responses are expressed relative to the WT maximal responses with mean ± SEM of 4–10 biological replicates. (B) EC50 values obtained from the Ca2+i concentration-response curves shown in panel A. (C-E) Concentration-response curves of Ca2+e-induced (C) NFAT luciferase reporter responses, (D) pERK responses expressed as the ratio of pERK to total ERK concentrations and (E) SRE reporter responses of HEK293 cells expressing WT (Ser657) or FHH1-associated (Tyr657) or ADH1-associated (Cys657) mutant CaSR proteins. Responses at each [Ca2+]e are expressed as a fold-change of basal [Ca2+]e responses and shown as mean ± SEM of 6–12 biological replicates. (F) Bias plots for Ca2+i and pERK signalling responses of mutations affecting the Ser657 CaSR disease-switch residue. Curves located above grey dotted line indicate signalling biased towards Ca2+i, while curves below grey dotted line indicate signalling biased towards pERK. Statistical analyses comparing WT versus Tyr657 (blue asterisk), and WT versus Cys657 (red asterisk) ****P-value < 0.0001, ***P-value < 0.001, **P-value < 0.01, *P-value < 0.05 compared to WT, by a two-way ANOVA with Tukey’s multiple-comparisons test.
