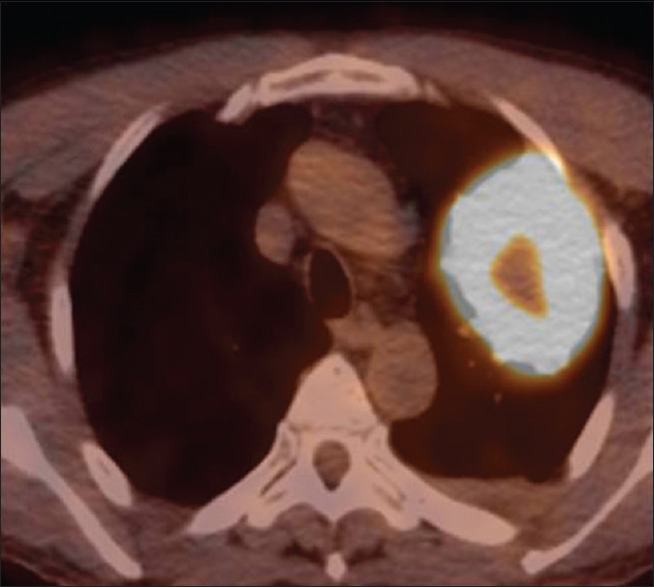
Figure 3.

Positron emission tomography–computed tomography shows a large mass with high uptake measuring maximum SUV of 17 in the left upper lung lobe. The central area of the mass reveals a relatively low uptake, which corresponds to low attenuation of the chest computed tomography
