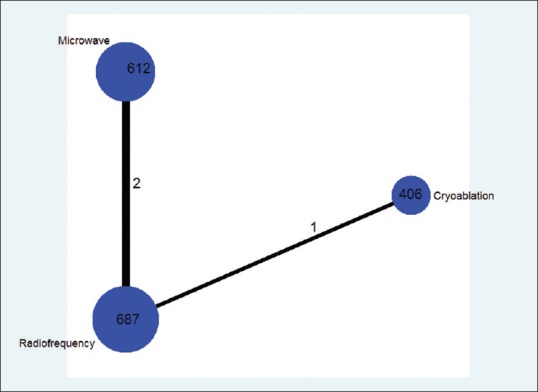
Figure 2.

Comparison network of the included studies The width of the lines is proportional to the number of direct comparisons from original studies, and the size of every circle is proportional to the number of randomly assigned participants (sample size)
