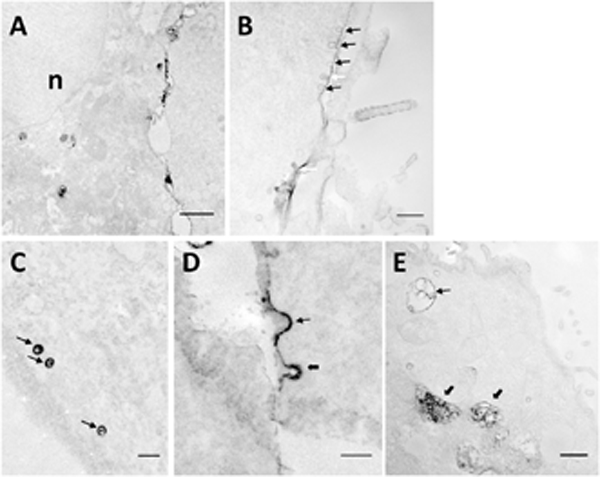
Figure 2. Subcellular features associated with dig-pDNA at 40 min after electrotransfection.

All images were acquired on COS7 cells. (A) The low magnification image shows the distribution of the EDS in the cell; n, nucleus. Bar = 1 μm. (B) A train of electron dense caveolae-like structures is visible. Black arrows indicate caveolae with membranes associated with the EDS. White arrows indicate caveolae partially filled with the EDS. Bar = 100 nm. (C) Typical caveolae-like structures are filled with the EDS indicated by arrows. Bar = 100 nm. (D) Two membrane invaginations are associated with the EDS. Thin and thick arrows indicate pits with smooth and rough membranes, respectively. Bar = 100 nm. (E) An early endosome-like structure and two late endosome/lysosome- like structures are associated with the EDS, as indicated by the thin and the thick arrows, respectively. Bar = 500 nm.
