
Figure 2.
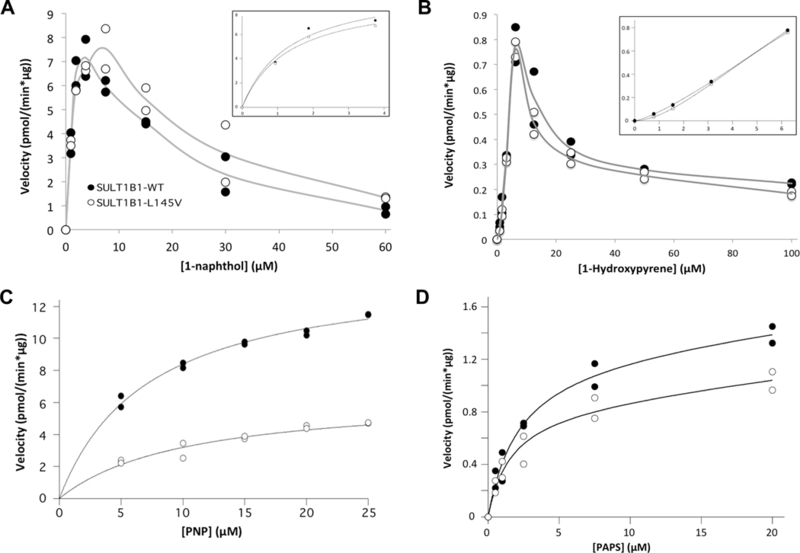
SULT1B1-L145V (white circles) displays different kinetic properties than SULT1B1-WT (opaque circles). (A) The 1-naphthol Km is unchanged while substrate inhibition is less potent for the L145V isoform. The inset provides an enhanced view of the curve preceding substrate inhibition. (B) The 1-hydroxypyrene sulfation curve is nearly identical for both isoforms, though the sigmoidal nature of the curve, as shown in the inset’s enhanced view of the curve before substrate inhibition, prevents the calculation of an accurate Km. Instead, the Ks (the nth root of K0, composed of the ‘‘interaction factors’’) for the WT isoform was calculated to be 33.5 ± 10.8 µM, while the L145V isoform exhibits a Ks of 7.7 ± 0.3 µM. (C) SULT1B1-L145V’s PNP Km is less favorable than that of the WT enzyme, while its maximal velocity is faster. (D) Finally, the L145V isoform’s PAPS Km appears to be slightly more favorable while the Vmax is significantly slower. These kinetic parameters with standard error of the mean can be found in Table 1.