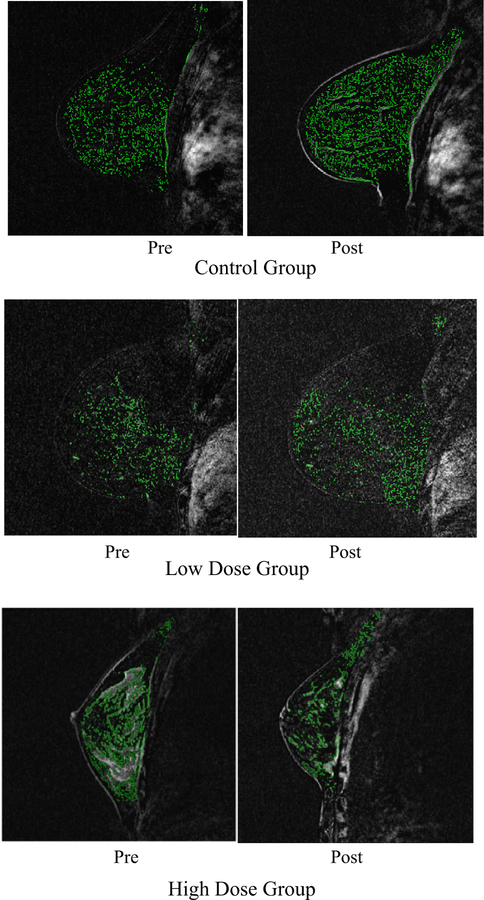
Fig. 3.
An example magnetic resonance image from three women among the 68 women at elevated breast cancer risk who underwent the imaging study. This image that shows examples of background parenchymal enhancement for 1 patient in each group: control-, low-, and high-dose groups, from baseline (month 1) and follow-up (month 7)

