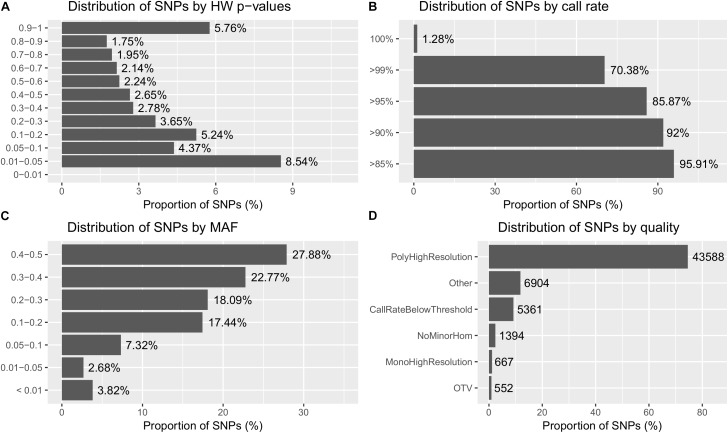
FIGURE 2.
Summary of the SNP metrics based on 58,466 SNPs on 4,947 GST® samples after being subjected to sample call rate in Best Practices Workflow of Axiom Analysis Suite software (see methodology). (A) Distribution of SNPs based on HW p-values obtained from the exact HWE test. (B) Distribution of SNPs based on SNP call rate. (C) Distribution of SNPs based on minor allele frequency (MAF). (D) Distribution of SNPs based on types of cluster formation (quality). The different types of clusters are based on the quality of the SNPs and has been described in the methodology.

