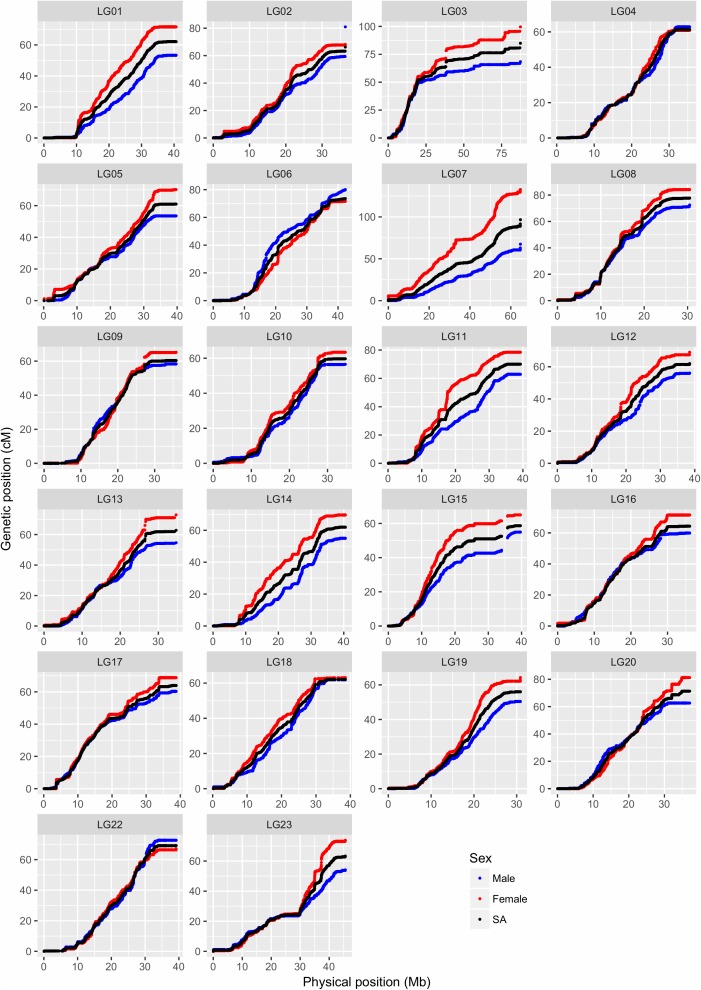
FIGURE 4.
Comparison of map positions between genetic and physical maps for different LGs in Build 2. The y-axis gives the linkage map positions, and the x-axis gives the physical positions. Linkage groups (LGs) and the physical positions are based on O_niloticus_UMD_NMBU Assembly. The maps are color-coded: red for female specific, blue for male specific, and black for sex-averaged linkage maps. Please note that the 22 LGs in the Nile tilapia have been named from LG01 to LG23 (no LG21).

