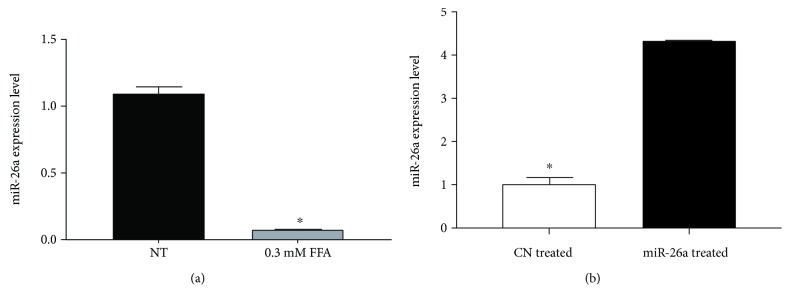
Figure 1.
Expression level of miR-26a after (a) FFA treatment of HepG2 cells. HepG2 cells were treated with 0.3 mM PA + OA in ratio 1 : 2 for 24 h. (b) After miR-26a overexpression using lentivirus, U6 snRNA was used as an internal control for miR-26a. Data were expressed as the mean ± SD from three separate experiments (∗P < 0.05). miR-26a: microRNA-26a; FFA: free fatty acid (PA: palmitic acid + OA: oleic acid); NT: nontreated HepG2 cells; CN treated: scrambled miR transduced stable cells treated with FFA; miR-26a treated: miR-26a transduced stable cells treated with FFA; SD: standard deviation.

