
Figure 2.
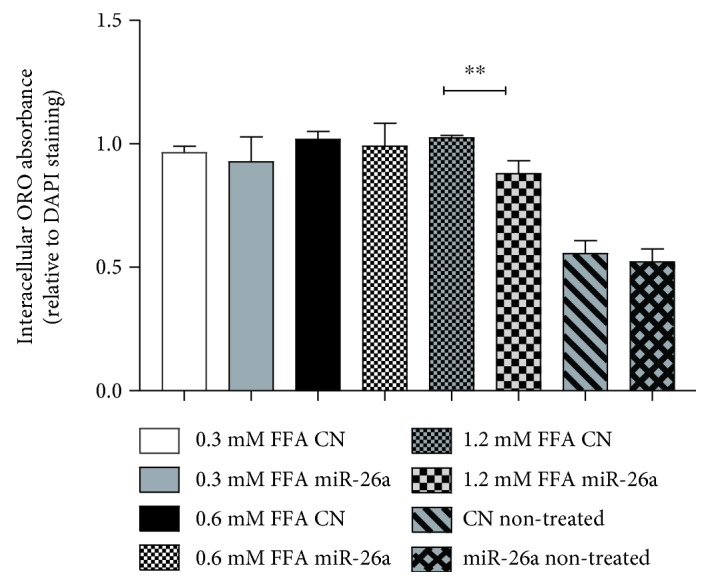
Intracellular Oil red O extract absorbance normalized with mean DAPI measurement in miR-26a stable cell line compared to control stable cell line treated with different FFA concentrations (0.3 mM, 0.6 mM, or 1.2 mM). Data were expressed as the mean ± SD from three separate experiments (∗∗P < 0.01).