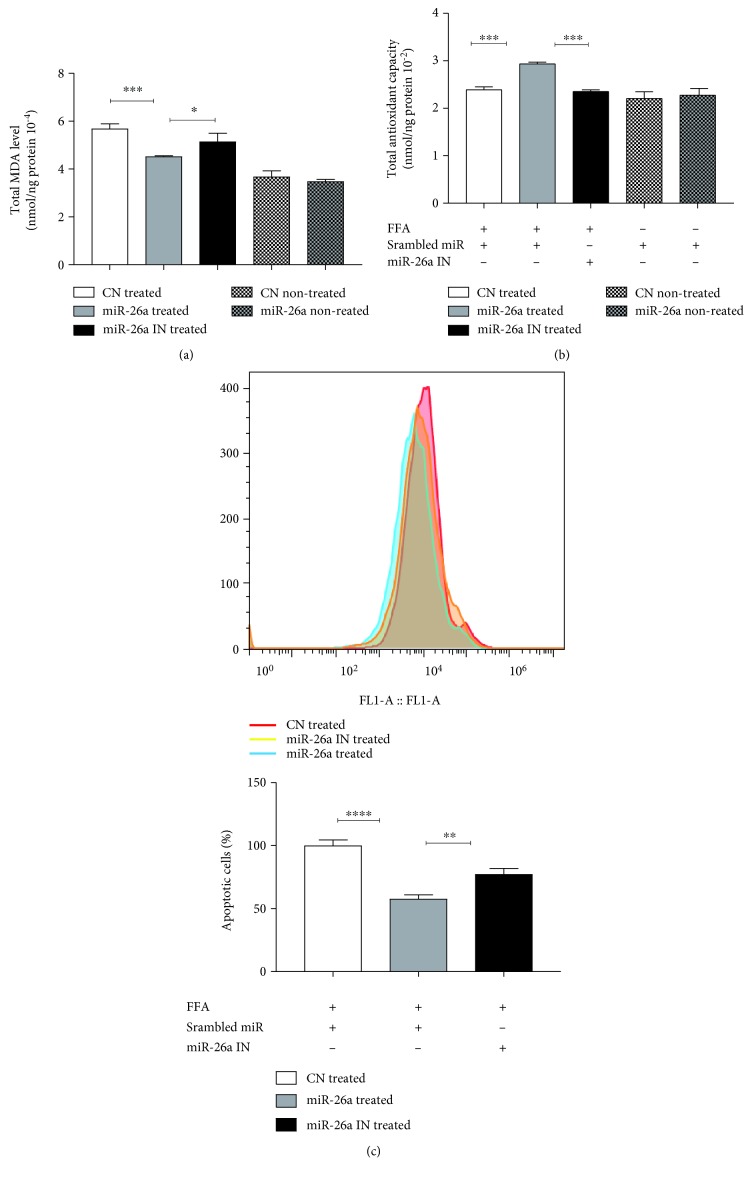
Figure 6.
Effect of miR-26a overexpression on (a) total MDA level, (b) total antioxidant level, and (c) apoptosis level indicated by flow cytometry. Group labels are the same as for Figure 3. Results shown are the mean ± SD (∗P < 0.05, ∗∗P < 0.01, ∗∗∗P < 0.001, and ∗∗∗∗P < 0.0001).

