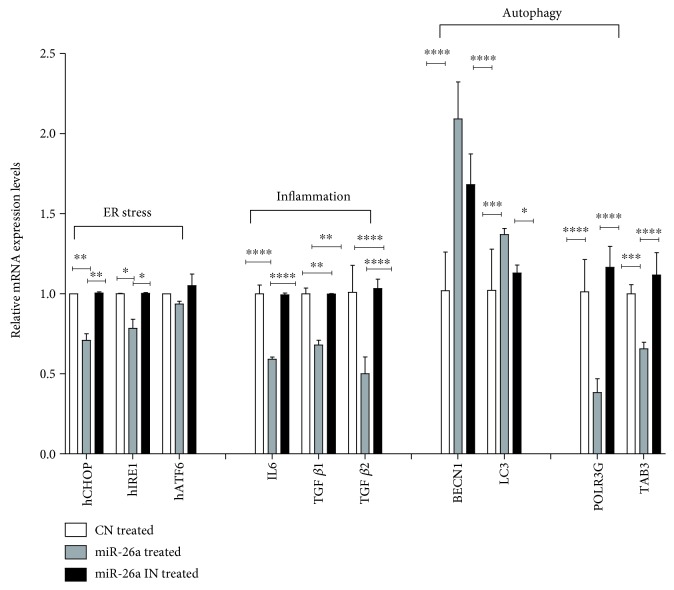
Figure 7.
Effect of miR-26a overexpression on expression of genes involved in ER stress markers hCHOP, hIRE1, and hATF6; expression of genes involved in inflammatory marker and IL-6 and fibrosis markers TGFβ1 and TGFβ2; mRNA expression of genes involved in autophagy BECN1 and LC3-II; and mRNA expression of POLR3G and TAB3. Group labels are the same as for Figure 3. Results shown are the mean ± SD (∗P < 0.05, ∗∗P < 0.01, ∗∗∗P < 0.001, and ∗∗∗∗P < 0.0001).

